USD/TRY Price Analysis: $11.80-75 zone restricts immediate downside
- USD/TRY remains pressured for the second consecutive day after refreshing record top.
- 100-HMA, weekly support line limits immediate downside as MACD teases bulls.
- 200-HMA adds to the downside filter, $12.80 guards recovery moves.
USD/TRY stays depressed around $12.00, sidelined near $11.93 ahead of Thursday’s European session.
In doing so, the Turkish lira (TRY) pair extends pullback moves from the all-time high marked on Tuesday.
However, a convergence of the 100-HMA and an ascending trend line from November 18, near $11.80-75, becomes a tough nut to crack for the bears considering recently improving MACD conditions.
Even if the quote drops below $11.75, the 61.8% Fibonacci retracement (Fibo.) of November 18-23 upside and 200-HMA, respectively around $11.60 and $11.10 will challenge the USD/TRY bears.
Alternatively, 38.2% Fibo. limits immediate recovery of the pair around $12.35, a break of which will direct USD/TRY buyers towards a confluence of two-day-old resistance line and 23.6% Fibonacci retracement level of $12.80.
In a case where the pair rises past $12.80, Thursday’s high of $13.20 may act as a buffer during the run-up to refresh the record top, currency around $13.50.
USD/TRY: Hourly chart
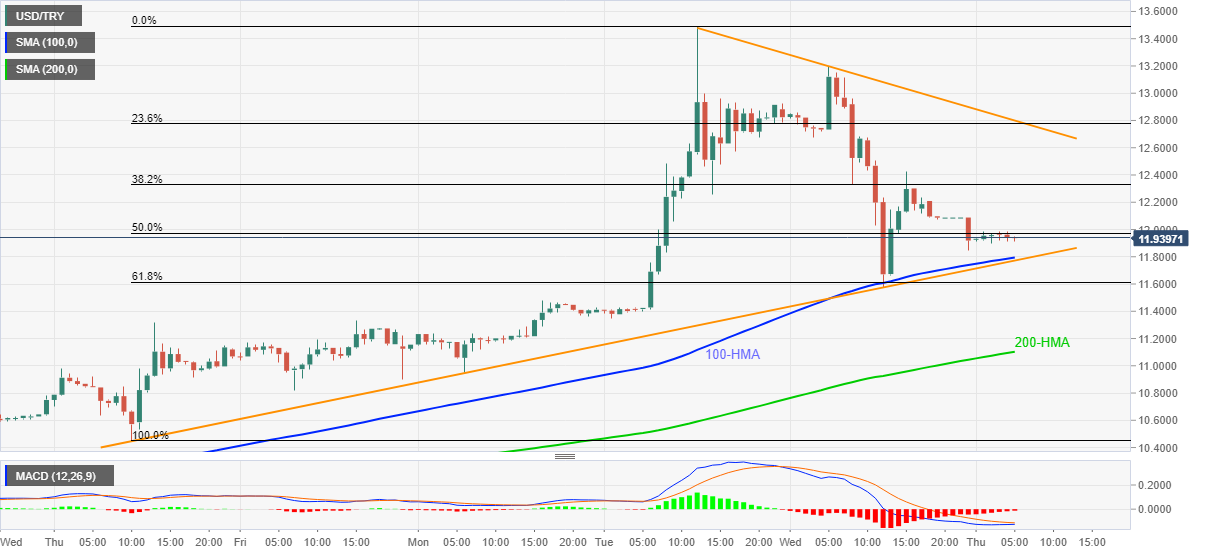
Trend: Bullish
Author

Anil Panchal
FXStreet
Anil Panchal has nearly 15 years of experience in tracking financial markets. With a keen interest in macroeconomics, Anil aptly tracks global news/updates and stays well-informed about the global financial moves and their implications.


