|

USD/RUB Price Analysis: Further downside needs validation from 62.80

  • USD/RUB holds lower ground near two-year low, pressured of late.
  • Falling wedge bullish chart pattern, Dragonfly Doji tests USD/RUB sellers.
  • Bulls need clear break of 200-DMA to retake control.

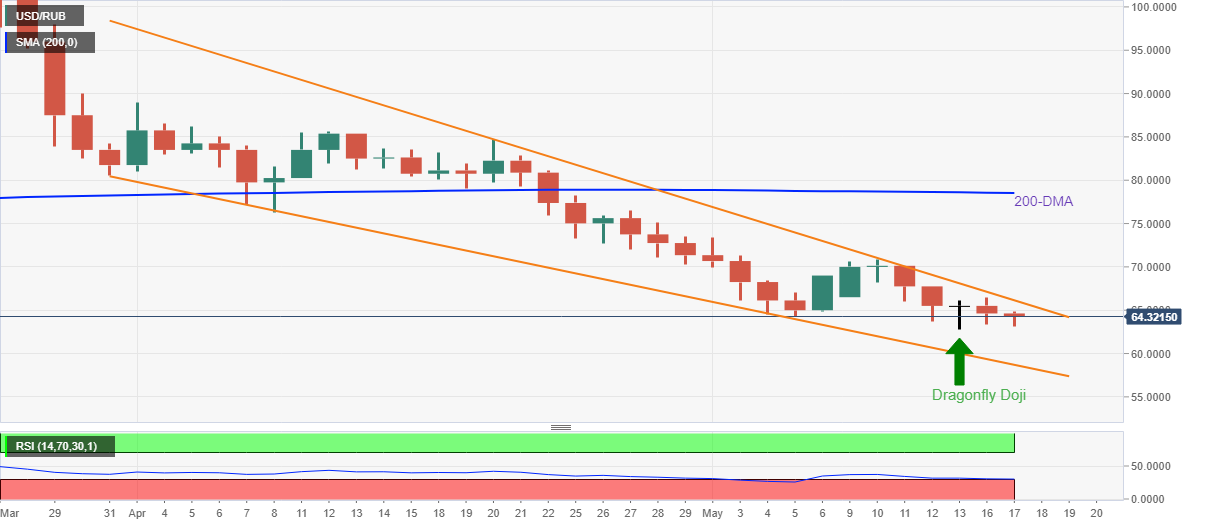
USD/RUB remains on the back foot for the second consecutive day, after bouncing off a two-year low. That said, the Russian ruble (RUB) pair seesaws around 64.31 by the press time of the pre-European session opening on Tuesday.

Although the quote refrains from renewing the multi-month low of late, a sustained trading below the 200-DMA and a monthly falling trend line, forming part of the falling wedge bullish chart pattern, challenges the recovery moves.

Even so, oversold RSI conditions hint at an intermediate recovery of the USD/RUB prices, which highlights the aforementioned resistance line of the wedge, around 66.15, as a nearby key hurdle ahead of the 200-DMA level surrounding 78.50.

In a case where USD/RUB rises past 78.50, the 80.00 threshold and April’s high of 84.75 will be in focus for short-term upside moves. However, any further advances beyond 84.75 could help the bulls to approach the theoretical target of the wedge, around 92.00.

Meanwhile, a downside break of the latest low near 62.80 rejects the bullish signals flashed by the Dragonfly Doji candlestick.

Following that, a downward trajectory towards the wedge’s support line, at 58.70 by the press time, can’t be ruled out.

USD/RUB: Daily chart

Trend: Limited downside expected

Additional important levels

Overview
Today last price64.318
Today Daily Change-0.3070
Today Daily Change %-0.48%
Today daily open64.625
 
Trends
Daily SMA2071.615
Daily SMA5087.1225
Daily SMA10084.2575
Daily SMA20078.5631
 
Levels
Previous Daily High66.5
Previous Daily Low63.307
Previous Weekly High70.875
Previous Weekly Low62.8324
Previous Monthly High89
Previous Monthly Low70.275
Daily Fibonacci 38.2%64.5267
Daily Fibonacci 61.8%65.2803
Daily Pivot Point S163.1213
Daily Pivot Point S261.6177
Daily Pivot Point S359.9283
Daily Pivot Point R166.3143
Daily Pivot Point R268.0037
Daily Pivot Point R369.5073

Author

Anil Panchal

Anil Panchal

FXStreet

Anil Panchal has nearly 15 years of experience in tracking financial markets. With a keen interest in macroeconomics, Anil aptly tracks global news/updates and stays well-informed about the global financial moves and their implications.

More from Anil Panchal
Share:

Editor's Picks

EUR/USD trims gains, hovers around 1.1900 post-US data

EUR/USD trades slightly on the back foot around the 1.1900 region in a context dominated by the resurgence of some buying interest around the US Dollar on turnaround Tuesday. Looking at the US docket, Retail Sales disappointed expectations in December, while the ADP 4-Week Average came in at 6.5K.

GBP/USD declines toward 1.3650 on renewed USD strength

GBP/USD stays on the back foot and declines to the 1.3650 region on Tuesday. The negative shift seen in risk mood helps the US Dollar (USD) gather strength and makes it difficult for the pair to find a foothold. The immediate focus is now on the US Retail Sales data. 

Gold stabilizes above $5,000 ahead of US data

Gold enters a consolidation phase after posting strong gains on Monday but stays above the $5,000 psychological mark and the daily swing low. US Treasury bond yields continue to edge lower on news of Chinese regulators advising financial institutions to curb holdings of US Treasuries, helping XAU/USD hold its its ground.

Bitcoin Cash trades lower, risks dead-cat bounce amid bearish signals

Bitcoin Cash trades in the red below $522 at the time of writing on Tuesday, after multiple rejections at key resistance. BCH’s derivatives and on-chain indicators point to growing bearish sentiment and raise the risk of a dead-cat bounce toward lower support levels.

Dollar drops and stocks rally:  The week of reckoning for US economic data

Following a sizeable move lower in US technology Stocks last week, we have witnessed a meaningful recovery unfold. The USD Index is in a concerning position; the monthly price continues to hold the south channel support.

Bitcoin Cash trades lower, risks dead-cat bounce amid bearish signals

Bitcoin Cash (BCH) trades in the red below $522 at the time of writing on Tuesday, after multiple rejections at key resistance. BCH’s derivatives and on-chain indicators point to growing bearish sentiment and raise the risk of a dead-cat bounce toward lower support levels.