|

USD/PLN Price Analysis: Bulls take a breather, still the pair flashes overbought conditions

  • USD/PLN declined by more than 0.70% towards the 4.3000 level.
  • Polish government showed concerns about the zloty weakness and added that it should be considered.
  • The USD is holding its foot after inflation figures from August.

The USD/PLN declined towards the 4.3000 level, as Polish policymakers have pointed out that they will consider the zloty weakness in the next monetary policy decisions. 

Pawel Borys, a senior aide to Prime Minister Morawiecki, was the one who expressed concerns about the weakening of the currency beyond what he considered below the "optimal" as the USD/PLN rose by more than 4% in the last week, driven by the unexpected decision by the Polish central bank to cut rates by 75 basis points. It is worth noting that the Polish central bank governor, Adam Glapinski, justified the rate cuts due to local inflation moderating. Still, markets considered the move political with elections around the corner, which drove investors to dump the Zloty as the Narodowy Bank Polski's (NBP) credibility took a big hit.

On the US side, the Greenback is holding its foot after the US Bureau of Labor Statistics (BLS) reported that the Consumer Price Index (CPI) rose to 3.7% YoY, higher than the 3.2% in July and beating the expected 3.6%. Conversely, the Core measure eased to 4.3% YoY, matching expectations. As a reaction, the USD is holding its foot as, according to the CME FedWatch tool, market participants still foresee nearly 40% of the odds of a 25 basis point hike by the Fed in 2023.
 

USD/PLN Levels to watch 

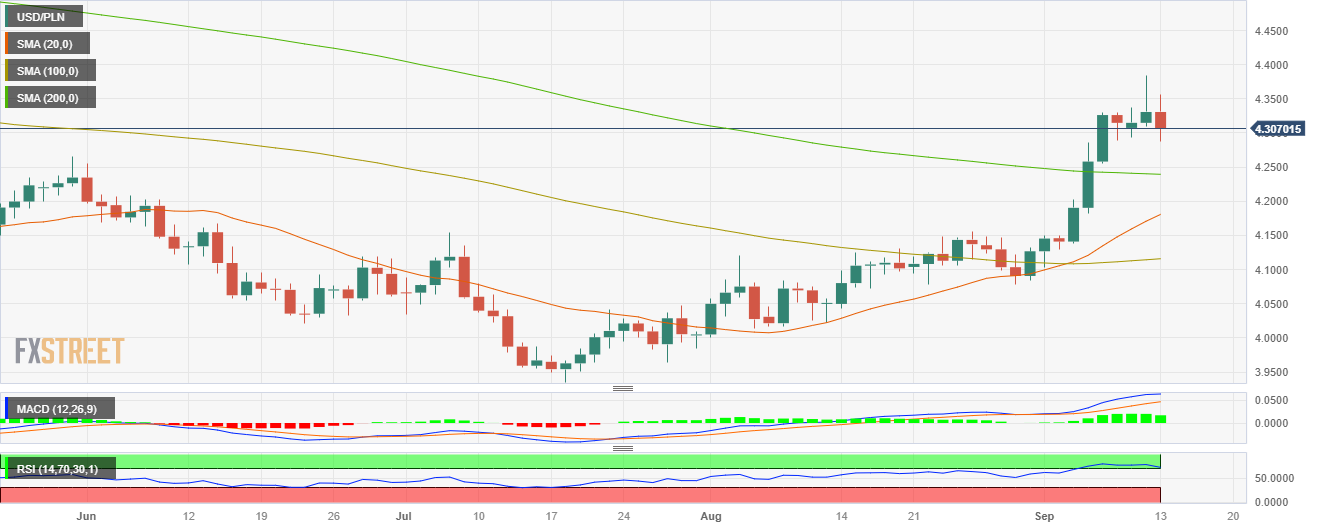
On the technical front, the USD/PLN indicates an overbought sentiment. This implies the potential for a short-term technical recovery, with a possible increase in downward movements. The Relative Strength Index (RSI) is seen above the 70 threshold, while the Moving Average Convergence (MACD) presents neutral green bars. Furthermore, the pair is above the 20,100,200-day Simple Moving Average (SMAs), indicating that the bulls are in command of the broader picture.

 Support levels: 4.2400 (200-day SMA), 4.1810 (20-day SMA), 4.1700.

 Resistance levels: 4.3200, 4.3500, 4.3800.

USD/PLN Daily Chart

USD/PLN

Overview
Today last price4.3065
Today Daily Change-0.0243
Today Daily Change %-0.56
Today daily open4.3308
 
Trends
Daily SMA204.1708
Daily SMA504.0866
Daily SMA1004.1144
Daily SMA2004.2403
 
Levels
Previous Daily High4.3842
Previous Daily Low4.3088
Previous Weekly High4.3306
Previous Weekly Low4.1291
Previous Monthly High4.1554
Previous Monthly Low4.001
Daily Fibonacci 38.2%4.3554
Daily Fibonacci 61.8%4.3376
Daily Pivot Point S14.2983
Daily Pivot Point S24.2659
Daily Pivot Point S34.223
Daily Pivot Point R14.3737
Daily Pivot Point R24.4166
Daily Pivot Point R34.449

Author

Patricio Martín

Patricio is an economist from Argentina passionate about global finance and understanding the daily movements of the markets.

More from Patricio Martín
Share:

Editor's Picks

AUD/USD eyes 0.7150 barrier nine-day EMA

AUD/USD inches higher after registering modest losses in the previous day, trading around 0.7130 during the Asian hours. The technical analysis of the daily chart indicates that the pair is moving sideways within the rectangle pattern, suggesting a consolidation as neither the bulls nor the bears have enough momentum to take control of the market.

USD/JPY trades below 160.00 intervention threshold; bullish bias intact

The USD/JPY pair attracts some sellers during the Asian session amid fears that authorities will step in again to prop up the Japanese Yen. Furthermore, the Israel-Lebanon truce prompts some profit-taking around the US Dollar and exerts downward pressure on the currency pair.

Gold defends 200-day SMA, rises toward $4,500

Gold is attempting a tepid recovery toward $4,500 on Thursday, as renewed optimism in the Mideast geopolitical front calms market nerves. This cautious optimism across Asian markets weighs on Oil prices, and diminishes the US Dollar’s safe-haven appeal, helping Gold stage a decent comeback from the weekly low of $4,424.


Hyperliquid: ETF demand, capital rotation fuel HYPE rally as Bitcoin melts

Hyperliquid price sustains an upward trend near its all-time high of $75.76 on Thursday after posting 80% gains in May, while Bitcoin (BTC) retraces below $65,000, triggering a market-wide panic.

Kevin Warsh takes the Fed helm: What it means for the US Dollar
The Federal Reserve moves away from the highly predictable "forward guidance" model of the Jerome Powell era to a new “Kevin Warsh environment”, characterized by less communication, more policy surprises, and an increased focus on the Fed's complex balance sheet.
Recession on paper: What really moves the Canadian Loonie now?

Statistics Canada handed the headline writers a gift and the analysts a headache. Real GDP shrank 0.1% on an annualized basis in the first quarter, and with the fourth quarter of 2025 revised down to a 1.0% contraction, that is two negative quarters in a row, the textbook definition of a technical recession and Canada's first since the pandemic.