|

USD/MXN Price Analysis: Well bid near three-month top, seems poised to appreciate further

  • USD/MXN scales higher for the sixth straight day and touches a three-month high on Thursday.
  • The recent breakout through the 100-day SMA and the 17.40-45 hurdle favour bullish traders.
  • The slightly overbought RSI on the daily chart is seen as the only factor capping further gains.

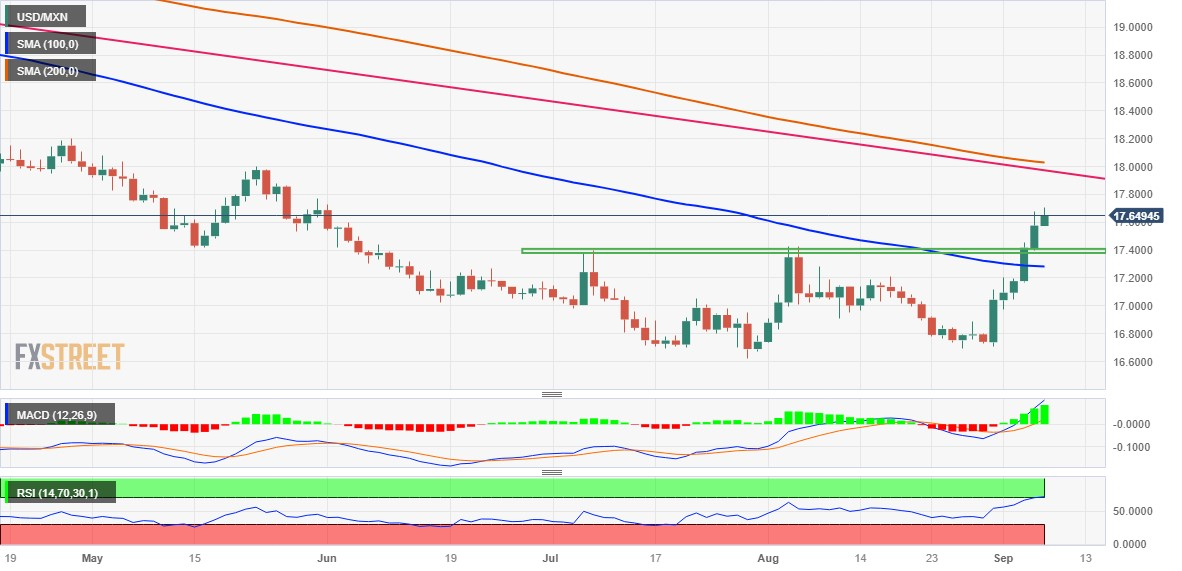
The USD/MXN pair gains strong positive traction for the sixth successive day on Thursday and jumps to over a three-month top during the early part of the European session. Spot prices, however, retreat a few pips in the last hour and currently trade near the 17.65 region, still up nearly 0.40% for the day.

From a technical perspective, this week's sustained move and acceptance above the 100-day Simple Moving Average (SMA), for the first time since September 2022, was seen as a fresh trigger for bullish traders. A subsequent breakout through the 17.40-17.45 strong horizontal barrier prompted some follow-through technical buying and might have already set the stage for a further near-term appreciating move.

That said, the Relative Strength Index (RSI) on the daily chart is already flashing overbought conditions and makes it prudent to wait for some near-term consolidation or a modest pullback before placing fresh bets. Nevertheless, the USD/MXN pair seems poised to build on its sharp rise witnessed over the past week or so and aim to challenge the very important 200-day SMA, currently around the 18.00 mark.

The said handle coincides with a downward sloping trend-line extending from the September 2022 swing high and should act as a key pivotal point, which if cleared decisively should pave the way for additional gains.

On the flip side, any meaningful corrective slide below the daily trough, around the 17.60-17.55 region, could be seen as a buying opportunity and remain limited near the 17.45-17.40 resistance breakpoint. This is closely followed by the 100-day SMA, around the 17.30-17.25 zone. Failure to defend the said support levels might prompt some technical selling and drag the USD/MXN pair back towards the 17.00 round figure.

USD/MXN daily chart

fxsorignial

Technical levels to watch

USD/MXN

Overview
Today last price17.6367
Today Daily Change0.0609
Today Daily Change %0.35
Today daily open17.5758
 
Trends
Daily SMA2017.0289
Daily SMA5016.9892
Daily SMA10017.2853
Daily SMA20018.0364
 
Levels
Previous Daily High17.6772
Previous Daily Low17.3957
Previous Weekly High17.2025
Previous Weekly Low16.6945
Previous Monthly High17.4274
Previous Monthly Low16.6945
Daily Fibonacci 38.2%17.5697
Daily Fibonacci 61.8%17.5032
Daily Pivot Point S117.4219
Daily Pivot Point S217.2681
Daily Pivot Point S317.1404
Daily Pivot Point R117.7034
Daily Pivot Point R217.8311
Daily Pivot Point R317.9849

Author

Haresh Menghani

Haresh Menghani is a detail-oriented professional with 10+ years of extensive experience in analysing the global financial markets.

More from Haresh Menghani
Share:

Markets move fast. We move first.

Orange Juice Newsletter brings you expert driven insights - not headlines. Every day on your inbox.

By subscribing you agree to our Terms and conditions.

Editor's Picks

EUR/USD rebounds after falling toward 1.1700

EUR/USD gains traction and trades above 1.1730 in the American session, looking to end the week virtually unchanged. The bullish opening in Wall Street makes it difficult for the US Dollar to preserve its recovery momentum and helps the pair rebound heading into the weekend.

GBP/USD steadies below 1.3400 as traders assess BoE policy outlook

Following Thursday's volatile session, GBP/USD moves sideways below 1.3400 on Friday. Investors reassess the Bank of England's policy oıtlook after the MPC decided to cut the interest rate by 25 bps by a slim margin. Meanwhile, the improving risk mood helps the pair hold its ground.

Gold stays below $4,350, looks to post small weekly gains

Gold struggles to gather recovery momentum and stays below $4,350 in the second half of the day on Friday, as the benchmark 10-year US Treasury bond yield edges higher. Nevertheless, the precious metal remains on track to end the week with modest gains as markets gear up for the holiday season.

Crypto Today: Bitcoin, Ethereum, XRP rebound amid bearish market conditions

Bitcoin (BTC) is edging higher, trading above $88,000 at the time of writing on Monday. Altcoins, including Ethereum (ETH) and Ripple (XRP), are following in BTC’s footsteps, experiencing relief rebounds following a volatile week.

How much can one month of soft inflation change the Fed’s mind?

One month of softer inflation data is rarely enough to shift Federal Reserve policy on its own, but in a market highly sensitive to every data point, even a single reading can reshape expectations. November’s inflation report offered a welcome sign of cooling price pressures. 

XRP rebounds amid ETF inflows and declining retail demand demand

XRP rebounds as bulls target a short-term breakout above $2.00 on Friday. XRP ETFs record the highest inflow since December 8, signaling growing institutional appetite.