USD/MXN Price Analysis: Struggles near two-week low, seems vulnerable below 61.8% Fibo.


Share:
  • USD/MXN edges lower for the seventh straight day and touches over a two-week low on Monday.
  • Acceptance below the 61.8% Fibo. and negative oscillators support prospects for further downfall.
  • A sustained move beyond the 17.20-25 confluence hurdle is needed to negative the bearish outlook.

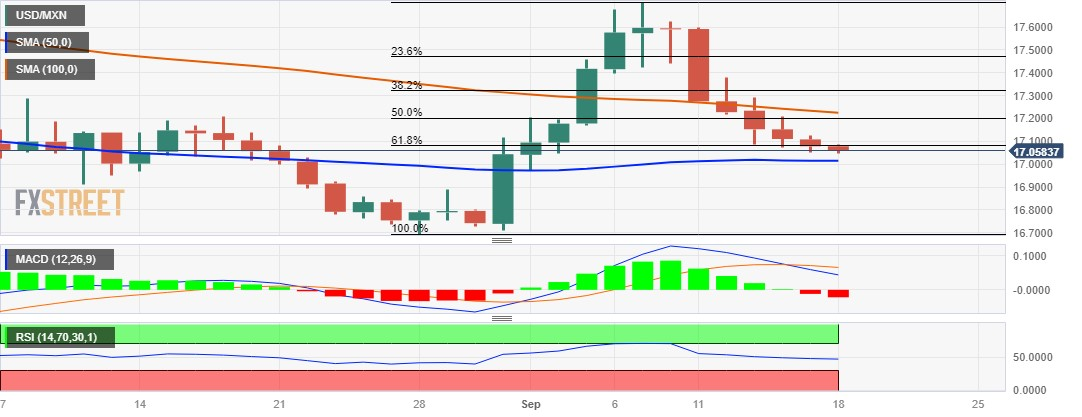
The USD/MXN pair remains depressed for the seventh straight day and slides to over a two-week low, around the 17.0485 level during the Asian session on Monday.

From a technical perspective, acceptance below the 61.8% Fibonacci retracement level of the rally from the August monthly swing low might have already set the stage for a further depreciating move for spot prices. The negative outlook is reinforced by the fact that oscillators on the daily chart have just started drifting into bearish territory. This, in turn, suggests that the path of least resistance for the USD/MXN pair is to the downside.

That said, it will still be prudent to wait for a convincing break below the 50-day Simple Moving Average (SMA), currently pegged around the 17.0270 area, before placing fresh bearish bets. The USD/MXN pair might then turn vulnerable to weaken further below the 17.0000 psychological mark, towards testing the next relevant support near the 16.8885 area before dropping to the multi-year trough, near the 16.6945 region touched in August.

On the flip side, any meaningful recovery might now confront stiff resistance and is more likely to remain capped near the 17.2060-17.2280 confluence, comprising the 50% Fibo. level and the 100-day SMA. Some follow-through buying, however, should lift the USD/MXN pair to the 38.2% Fibo. level, around the 17.3300 region en route to the 23.6% Fibo. barrier near the 17.4775 area and the multi-month top, around the 17.7090-17.7095 zone.

USD/MXN daily chart

fxsoriginal

Technical levels to watch

USD/MXN

Overview
Today last price 17.0581
Today Daily Change -0.0201
Today Daily Change % -0.12
Today daily open 17.0782
 
Trends
Daily SMA20 17.0986
Daily SMA50 17.015
Daily SMA100 17.2333
Daily SMA200 17.9561
 
Levels
Previous Daily High 17.1269
Previous Daily Low 17.0504
Previous Weekly High 17.5959
Previous Weekly Low 17.0504
Previous Monthly High 17.4274
Previous Monthly Low 16.6945
Daily Fibonacci 38.2% 17.0796
Daily Fibonacci 61.8% 17.0977
Daily Pivot Point S1 17.0434
Daily Pivot Point S2 17.0087
Daily Pivot Point S3 16.9669
Daily Pivot Point R1 17.1199
Daily Pivot Point R2 17.1617
Daily Pivot Point R3 17.1964


Share: Feed news

Information on these pages contains forward-looking statements that involve risks and uncertainties. Markets and instruments profiled on this page are for informational purposes only and should not in any way come across as a recommendation to buy or sell in these assets. You should do your own thorough research before making any investment decisions. FXStreet does not in any way guarantee that this information is free from mistakes, errors, or material misstatements. It also does not guarantee that this information is of a timely nature. Investing in Open Markets involves a great deal of risk, including the loss of all or a portion of your investment, as well as emotional distress. All risks, losses and costs associated with investing, including total loss of principal, are your responsibility. The views and opinions expressed in this article are those of the authors and do not necessarily reflect the official policy or position of FXStreet nor its advertisers. The author will not be held responsible for information that is found at the end of links posted on this page.

If not otherwise explicitly mentioned in the body of the article, at the time of writing, the author has no position in any stock mentioned in this article and no business relationship with any company mentioned. The author has not received compensation for writing this article, other than from FXStreet.

FXStreet and the author do not provide personalized recommendations. The author makes no representations as to the accuracy, completeness, or suitability of this information. FXStreet and the author will not be liable for any errors, omissions or any losses, injuries or damages arising from this information and its display or use. Errors and omissions excepted.

The author and FXStreet are not registered investment advisors and nothing in this article is intended to be investment advice.

Follow us on Telegram

Stay updated of all the news

Join Telegram

Recommended content


Follow us on Telegram

Stay updated of all the news

Join Telegram

Recommended content

Editors’ Picks

EUR/USD loses traction, retreats below 1.0600

EUR/USD loses traction, retreats below 1.0600

EUR/USD lost its recovery momentum and declined below 1.0600 in the American session on Friday, erasing a portion of its daily gains in the process. Nevertheless, the risk-positive market atmosphere after PCE inflation data helps the pair limit its losses.

EUR/USD News

GBP/USD turns negative on the day below 1.2200

GBP/USD turns negative on the day below 1.2200

GBP/USD reversed its direction and slumped below 1.2200 in the American session on Friday after rising above 1.2270 earlier in the day. Position readjustments and profit-taking on the last trading day of the quarter seems to be weighing on Pound Sterling.

GBP/USD News

Gold reverses direction, drops below $1,860

Gold reverses direction, drops below $1,860

Following a steady rebound toward $1,880 on Friday, Gold price made a sharp U-turn and turned negative on the day near $1,860. Although the 10-year US T-bond yield is down more than 1%, XAU/USD struggles to find demand on the last day of Q3.

Gold News

Polkadot Price Forecast: DOT reversal seems inevitable after 92% correction from all-time high

Polkadot Price Forecast: DOT reversal seems inevitable after 92% correction from all-time high

Polkadot price, in nearly two years, has shed 92.91% from its all-time high of $55.09. The massive downswing in DOT has pushed it down to levels that were last seen in October 2020. Hence, the chances of this altcoin forming a bottom and rallying are high. 

Read more

Earnings beat triggers Nike to spike 9%

Earnings beat triggers Nike to spike 9%

Nike (NKE) stock has surged over 9% in Friday’s premarket, climbing above $98 per share, following late Thursday’s fiscal first-quarter earnings release. Nike beat pessimistic earnings expectations by more than 23% and hiked its dividend by 9%.

Read more

Forex MAJORS

Cryptocurrencies

Signatures