USD/MXN Price Analysis: Sharp decline after being unable to break 20.25
- USD/MXN fails to break critical resistance at 20.25.
- Below 20.00, next strong support stands at 19.80.

The USD/MXN is falling sharply on Friday, amid a broad-based decline of the US Dollar. The decline of the pair takes place after being unable to break a key resistance area around 20.25.
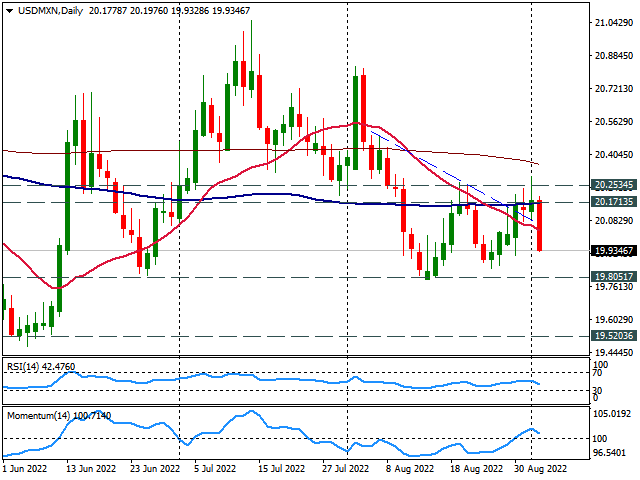
So far, USD/MXN bottomed at 19.92 and is it about to test the 19.90 short-term support. Technical indicators favor the downside, with RSI turning shout, like Momentum which still remains above 100. Price is back under the 20-day Simple Moving Average.
Since mid-August, the pair is moving sideways in a range between 19.80 and 20.25. If reached, the 19.80 zone is likely to offer a rebound. A break lower, would point to the next support around 19.65.
The 20.25 has become critical to the upside. A break above should clear the way to more gains, targeting initially the 20.45 zone.
USD/MXN daily chart
Author

Matías Salord
FXStreet
Matías started in financial markets in 2008, after graduating in Economics. He was trained in chart analysis and then became an educator. He also studied Journalism. He started writing analyses for specialized websites before joining FXStreet.


