|

USD/MXN Price Analysis: Retreats towards multi-month low near 17.25 even as RSI prods Mexican Peso bulls

  • USD/MXN fades bounce off the lowest level since May 2016.
  • Fortnight-old support line, oversold RSI (14) line challenge Mexican Peso buyers.
  • 50-SMA restricts short-term USD/MXN upside ahead of the key 200-SMA hurdle.
  • Multiple support lines, year 2016 bottom stand tall to challenge pair sellers.

USD/MXN consolidates the biggest daily loss in nearly two weeks at the lowest levels since May 2016 heading into Monday’s European session. In doing so, the Mexican Peso (MXN) pair traces the market’s cautious mood, as well as positioning for the US inflation and Federal Reserve (Fed) monetary policy decision.

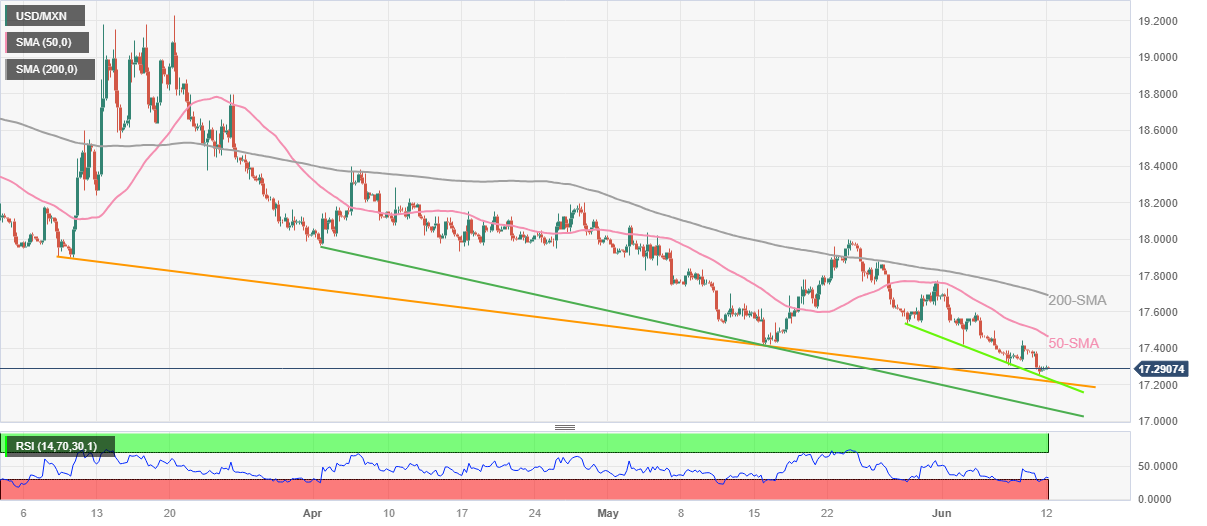
Technically, the USD/MXN pair struggle to defend the previous day’s bounce off a downward-sloping support line from May 29 amid oversold RSI (14).

Not only the oversold RSI conditions and the short-term support line, around 17.23 by the press time, but a three-month-old descending trend line, close to 17.21 at the latest, also challenge the USD/MXN bears.

It’s worth noting that a falling support line from early April, close to 17.06, precedes the year 2016 bottom of around 17.05 and the 17.00 round figure to challenge the Mexican Peso pair’s further declines.

On the contrary, the 50-SMA level of around 17.47 restricts the immediate upside of the USD/MXN pair ahead of the 200-SMA hurdle of 17.69.

In a case where the USD/MXN bulls manage to keep the reins past 17.69, as well as cross the 17.70 round figure, the corrective bounce may aim for the late May peak of around 17.99.

USD/MXN: Four-hour chart

Trend: Limited downside expected

Additional important levels

Overview
Today last price17.2908
Today Daily Change0.0101
Today Daily Change %0.06%
Today daily open17.2807
 
Trends
Daily SMA2017.6062
Daily SMA5017.8325
Daily SMA10018.1817
Daily SMA20018.9176
 
Levels
Previous Daily High17.3893
Previous Daily Low17.2591
Previous Weekly High17.5981
Previous Weekly Low17.2591
Previous Monthly High18.078
Previous Monthly Low17.4203
Daily Fibonacci 38.2%17.3088
Daily Fibonacci 61.8%17.3396
Daily Pivot Point S117.2301
Daily Pivot Point S217.1795
Daily Pivot Point S317.0999
Daily Pivot Point R117.3603
Daily Pivot Point R217.4399
Daily Pivot Point R317.4905

Author

Anil Panchal

Anil Panchal

FXStreet

Anil Panchal has nearly 15 years of experience in tracking financial markets. With a keen interest in macroeconomics, Anil aptly tracks global news/updates and stays well-informed about the global financial moves and their implications.

More from Anil Panchal
Share:

Markets move fast. We move first.

Orange Juice Newsletter brings you expert driven insights - not headlines. Every day on your inbox.

By subscribing you agree to our Terms and conditions.

Editor's Picks

EUR/USD bounces toward 1.1750 as US Dollar loses strength

EUR/USD returned to the 1.1750 price zone in the American session on Friday, despite falling Wall Street, which indicates risk aversion. Trading conditions remain thin following the New Year holiday and ahead of the weekend, with the focus shifting to US employment and European data scheduled for next week.

GBP/USD nears 1.3500, holds within familiar levels

After testing 1.3400 on the last day of 2025, GBP/USD managed to stage a rebound. Nevertheless, the pair finds it difficult to gather momentum and trades with modest intraday gains at around 1.3490 as market participants remain in holiday mood.

Gold trims intraday gains, approaches $4,300

Gold retreated sharply from the $4,400  area and trades flat for the day in the $4,320 price zone. Choppy trading conditions exacerbated the intraday decline, although XAU/USD bearish case is out of the picture, considering growing expectations for a dovish Fed and persistent geopolitical tensions.

Cardano gains early New Year momentum, bulls target falling wedge breakout

Cardano kicks off the New Year on a positive note and is extending gains, trading above $0.36 at the time of writing on Friday. Improving on-chain and derivatives data point to growing bullish interest, while the technical outlook keeps an upside breakout in focus.

Economic outlook 2026-2027 in advanced countries: Solidity test

After a year marked by global economic resilience and ending on a note of optimism, 2026 looks promising and could be a year of solid economic performance. In our baseline scenario, we expect most of the supportive factors at work in 2025 to continue to play a role in 2026.

Crypto market outlook for 2026

Year 2025 was volatile, as crypto often is.  Among positive catalysts were favourable regulatory changes in the U.S., rise of Digital Asset Treasuries (DAT), adoption of AI and tokenization of Real-World-Assets (RWA).