|

USD/MXN Price Analysis: Peso prints mild losses below 17.14 confluence ahead of Mexican Retail Sales

  • USD/MXN picks up bids to extend the previous day’s recovery from December 2015 lows.
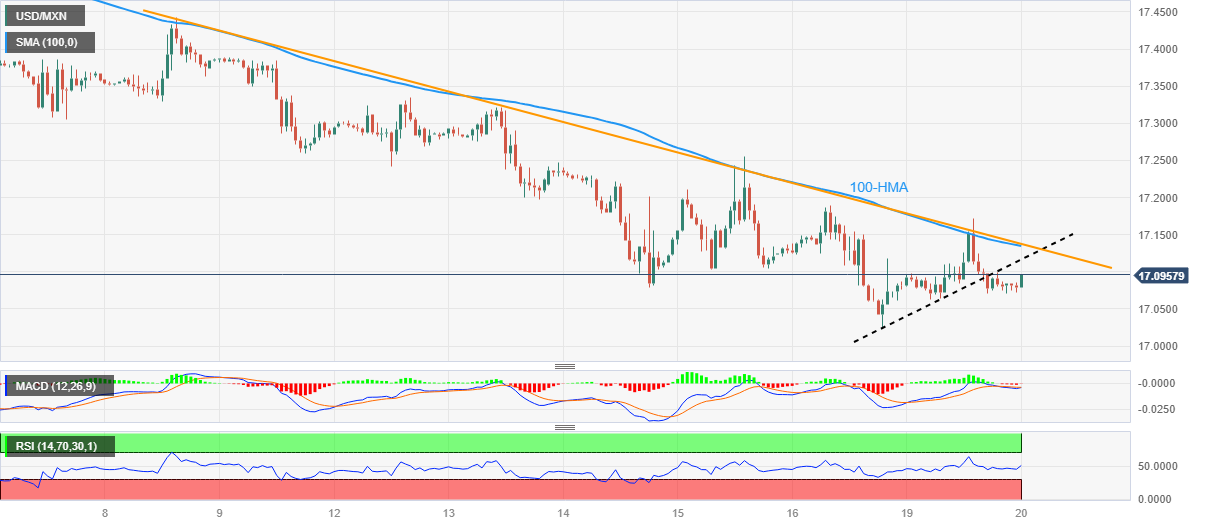
  • Convergence of weekly falling trend line, 100-HMA restricts immediate upside of Mexican Peso pair.
  • Near 50.0 RSI line, sluggish MACD signals keep Mexican Peso buyers to keep the reins.

USD/MXN remains on the front foot, clings to mild gains of late, as it pierces the 17.00 round figure during early Tuesday in Asia, up 0.07% on a day near 17.10 by the press time.

In doing so, the Mexican Peso (MXN) pair extends the previous day’s recovery from the lowest levels since December 2015 amid steady RSI (14) and sluggish MACD signals.

Although the oscillators suggest a continuation of the corrective bounce, the USD/MXN pair’s downside break of an upward-sloping support line from Friday, now immediate resistance near 17.12, prods the bulls.

Even if the Mexican Peso (MXN) pair rises past 17.12, a convergence of the 100-Hour Moving Average (HMA) and descending resistance line from June 08, close to 17.14, appears a tough nut to crack for the short-term USD/MXN buyers.

Following that, the quote may approach the previous monthly low of around 17.42 which holds the key for the USD/MXN bull run.

Meanwhile, the 17.00 psychological magnet puts a floor under the USD/MXN price, a break of which could direct the MXN buyers toward the mid-December 2015 low of around 16.89.

It’s worth noting that the multiple levels marked in 2015 together highlight 16.40-38 zone as the key support to watch for the USD/MXN bears past 16.89.

Overall, the USD/MXN pair is likely to remain bearish but a short-term recovery can’t be ruled out in a case where it manages to cross the 17.14 resistance confluence.

USD/MXN Price: Hourly chart

Trend: Limited recovery expected

Additional important levels

Overview
Today last price17.0903
Today Daily Change0.0099
Today Daily Change %0.06%
Today daily open17.0804
 
Trends
Daily SMA2017.4535
Daily SMA5017.7094
Daily SMA10018.0832
Daily SMA20018.8332
 
Levels
Previous Daily High17.1724
Previous Daily Low17.061
Previous Weekly High17.3353
Previous Weekly Low17.0243
Previous Monthly High18.078
Previous Monthly Low17.4203
Daily Fibonacci 38.2%17.1299
Daily Fibonacci 61.8%17.1036
Daily Pivot Point S117.0368
Daily Pivot Point S216.9932
Daily Pivot Point S316.9255
Daily Pivot Point R117.1482
Daily Pivot Point R217.216
Daily Pivot Point R317.2596

Author

Anil Panchal

Anil Panchal

FXStreet

Anil Panchal has nearly 15 years of experience in tracking financial markets. With a keen interest in macroeconomics, Anil aptly tracks global news/updates and stays well-informed about the global financial moves and their implications.

More from Anil Panchal
Share:

Markets move fast. We move first.

Orange Juice Newsletter brings you expert driven insights - not headlines. Every day on your inbox.

By subscribing you agree to our Terms and conditions.

Editor's Picks

EUR/USD moves sideways below 1.1800 on Christmas Eve

EUR/USD struggles to find direction and trades in a narrow channel below 1.1800 after posting gains for two consecutive days. Bond and stock markets in the US will open at the usual time and close early on Christmas Eve, allowing the trading action to remain subdued. 

GBP/USD keeps range around 1.3500 amid quiet markets

GBP/USD keeps its range trade intact at around 1.3500 on Wednesday. The Pound Sterling holds the upper hand over the US Dollar amid pre-Christmas light trading as traders move to the sidelines heading into the holiday season. 

Gold retreats from record highs, trades below $4,500

Gold retreats after setting a new record-high above $4,520 earlier in the day and trades in a tight range below $4,500 as trading volumes thin out ahead of the Christmas break. The US Dollar selling bias remains unabated on the back of dovish Fed expectations, which continues to act as a tailwind for the bullion amid persistent geopolitical risks.

Bitcoin slips below $87,000 as ETF outflows intensify, whale participation declines

Bitcoin price continues to trade around $86,770 on Wednesday, after failing to break above the $90,000 resistance. US-listed spot ETFs record an outflow of $188.64 million on Tuesday, marking the fourth consecutive day of withdrawals.

Economic outlook 2026-2027 in advanced countries: Solidity test

After a year marked by global economic resilience and ending on a note of optimism, 2026 looks promising and could be a year of solid economic performance. In our baseline scenario, we expect most of the supportive factors at work in 2025 to continue to play a role in 2026.

Avalanche struggles near $12 as Grayscale files updated form for ETF

Avalanche trades close to $12 by press time on Wednesday, extending the nearly 2% drop from the previous day. Grayscale filed an updated form to convert its Avalanche-focused Trust into an ETF with the US Securities and Exchange Commission.