|

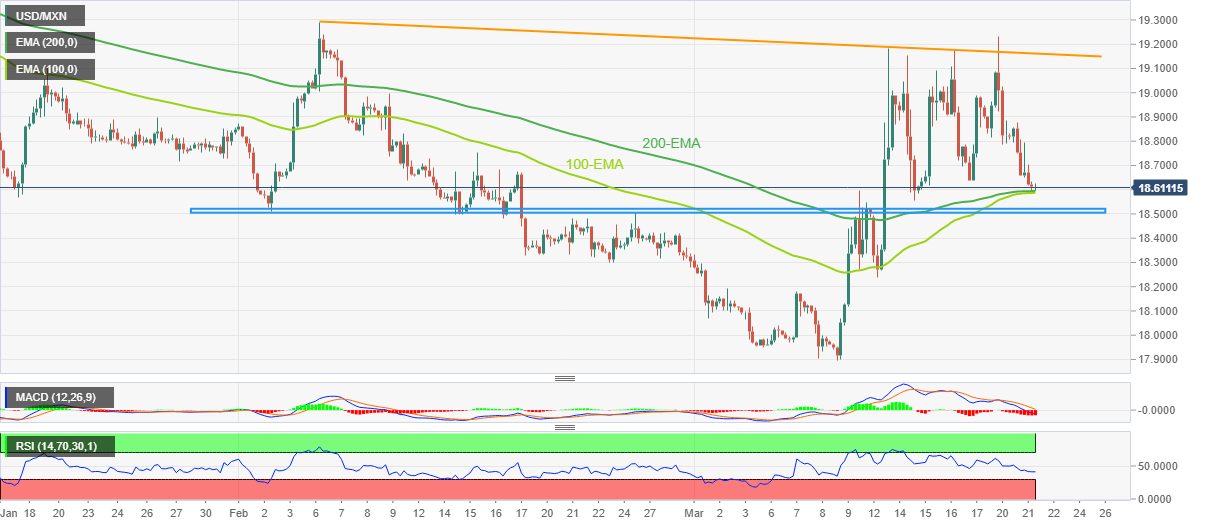
USD/MXN Price Analysis: Mexican Peso buyers poke key EMA convergence near 18.60

  • USD/MXN jostles with the 200-EMA, 100-EMA confluence to prod two-day downtrend.
  • Bearish MACD signals, downbeat RSI (14) suggest further declines.
  • Seven-week-old horizontal support appears tough nut to crack for bears.
  • Buyers need successful break of multi-day-old resistance line for conviction.

USD/MXN bears take a breather around 18.60 during early Wednesday as market players await the Federal Open Market Committee (FOMC) monetary policy meeting outcome.

Even so, the Mexican Peso (MXN) pair prints mild gains while snapping the previous two-day losing streak at the lowest levels in a week.

That said, the convergence of the 100-bar Exponential Moving Average (EMA) and the 200-EMA restricts the immediate downside of the USD/MXN pair.

However, the bearish MACD signals and downbeat RSI (14), not oversold, keeps sellers hopeful of breaking the 18.60 support confluence.

It’s worth noting, though, that the USD/MXN bears struggled to break the support confluence around 18.50 since early February. Maintenance of the resistance at 18.60 may see the pair may experience a decline towards 18.00.

During the anticipated fall, the mid-March swing low joins the early March peaks to highlight the 18.25-20 region  as an extra filter towards the south.

On the flip side, the USD/MXN pair’s rebound from the current levels can again aim for the 19.00 round figure before marking one more battle with a descending resistance line from early January, close to 19.20 at the latest.

Overall, USD/MXN is likely to remain pressured even if the room towards the south appears limited.

USD/MXN: Four-hour chart

Trend: Limited downside expected

Additional important levels

Overview
Today last price18.6135
Today Daily Change0.0165
Today Daily Change %0.09%
Today daily open18.597
 
Trends
Daily SMA2018.4231
Daily SMA5018.6178
Daily SMA10019.049
Daily SMA20019.6065
 
Levels
Previous Daily High18.8777
Previous Daily Low18.5925
Previous Weekly High19.1812
Previous Weekly Low18.2397
Previous Monthly High19.2901
Previous Monthly Low18.2954
Daily Fibonacci 38.2%18.7014
Daily Fibonacci 61.8%18.7688
Daily Pivot Point S118.5005
Daily Pivot Point S218.4039
Daily Pivot Point S318.2153
Daily Pivot Point R118.7857
Daily Pivot Point R218.9743
Daily Pivot Point R319.0709

Author

Anil Panchal

Anil Panchal

FXStreet

Anil Panchal has nearly 15 years of experience in tracking financial markets. With a keen interest in macroeconomics, Anil aptly tracks global news/updates and stays well-informed about the global financial moves and their implications.

More from Anil Panchal
Share:

Markets move fast. We move first.

Orange Juice Newsletter brings you expert driven insights - not headlines. Every day on your inbox.

By subscribing you agree to our Terms and conditions.

Editor's Picks

EUR/USD moves sideways below 1.1800 on Christmas Eve

EUR/USD struggles to find direction and trades in a narrow channel below 1.1800 after posting gains for two consecutive days. Bond and stock markets in the US will open at the usual time and close early on Christmas Eve, allowing the trading action to remain subdued. 

GBP/USD keeps range around 1.3500 amid quiet markets

GBP/USD keeps its range trade intact at around 1.3500 on Wednesday. The Pound Sterling holds the upper hand over the US Dollar amid pre-Christmas light trading as traders move to the sidelines heading into the holiday season. 

Gold retreats from record highs, trades below $4,500

Gold retreats after setting a new record-high above $4,520 earlier in the day and trades in a tight range below $4,500 as trading volumes thin out ahead of the Christmas break. The US Dollar selling bias remains unabated on the back of dovish Fed expectations, which continues to act as a tailwind for the bullion amid persistent geopolitical risks.

Bitcoin slips below $87,000 as ETF outflows intensify, whale participation declines

Bitcoin price continues to trade around $86,770 on Wednesday, after failing to break above the $90,000 resistance. US-listed spot ETFs record an outflow of $188.64 million on Tuesday, marking the fourth consecutive day of withdrawals.

Economic outlook 2026-2027 in advanced countries: Solidity test

After a year marked by global economic resilience and ending on a note of optimism, 2026 looks promising and could be a year of solid economic performance. In our baseline scenario, we expect most of the supportive factors at work in 2025 to continue to play a role in 2026.

Avalanche struggles near $12 as Grayscale files updated form for ETF

Avalanche trades close to $12 by press time on Wednesday, extending the nearly 2% drop from the previous day. Grayscale filed an updated form to convert its Avalanche-focused Trust into an ETF with the US Securities and Exchange Commission.