|

USD/MXN Price Analysis: Looking at 19.80 while under 20.00

  • USD/MXN with bearish bias in the very short-term, in range.
  • Next support below 19.90 at 19.80.
  • Critical resistance around 20.20/25.  

The USD/MXN is rising modestly on Monday as it remains trading near the weekly low it hit at the beginning of the week at 19.91. Momentum and technical indicators point to the downside in the very short-term. A break under 19.90 would expose the next support area at 19.80.

Since mid-August USD/MXN is moving sideways in a range between 19.80 and 20.25. The 19.80 should hold if tested in the near-term, offering a rebound. A firm break lower would weaken the dollar further, exposing 19.72.

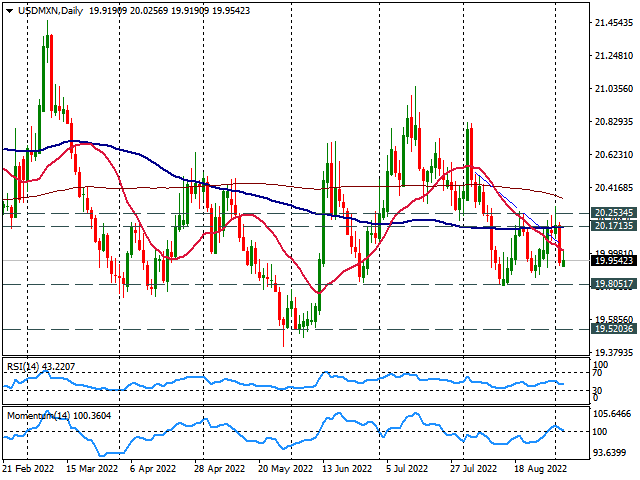
On the upside, the immediate resistance stands 20.02 (20-day Simple Moving Average) followed by 20.17. A daily close above 20.25, would change the short-term bias to neutral/bullish and should open the doors to more gains, targeting initially the 20.45 zone.

USD/MXN daily chart

USD/MXN

Overview
Today last price19.9726
Today Daily Change0.0241
Today Daily Change %0.12
Today daily open19.9485
 
Trends
Daily SMA2020.0368
Daily SMA5020.2895
Daily SMA10020.1677
Daily SMA20020.36
 
Levels
Previous Daily High20.2069
Previous Daily Low19.9258
Previous Weekly High20.2946
Previous Weekly Low19.9114
Previous Monthly High20.8261
Previous Monthly Low19.8019
Daily Fibonacci 38.2%20.0332
Daily Fibonacci 61.8%20.0995
Daily Pivot Point S119.8473
Daily Pivot Point S219.7461
Daily Pivot Point S319.5663
Daily Pivot Point R120.1283
Daily Pivot Point R220.3081
Daily Pivot Point R320.4093

Author

Matías Salord

Matías started in financial markets in 2008, after graduating in Economics. He was trained in chart analysis and then became an educator. He also studied Journalism. He started writing analyses for specialized websites before joining FXStreet.

More from Matías Salord
Share:

Editor's Picks

EUR/USD treads water around 1.1900

EUR/USD edges a tad lower around the 1.1900 area, coming under mild pressure despite the US Dollar keeps the offered stance on turnaround Tuesday. On the US data front, December Retail Sales fell short of expectations, while the ADP four week average printed at 6.5K.

GBP/USD looks weak near 1.3670

GBP/USD trades on the back foot around the 1.3670 region on Tuesday. Cable’s modest retracement also comes in tandem with the decent decline in the Greenback. Moving forward, the US NFP and CPI data in combination with key UK releases should kee the quid under scrutiny in the next few days.

Gold the battle of wills continues with bulls not ready to give up

Gold comes under marked selling pressure on Tuesday, giving back part of its recent two day advance and threatening to challenge the key $5,000 mark per troy ounce. The yellow metal’s correction follows a better tone in the risk complex, a lower Greenback and shrinking US Treasuty yields.

AI Crypto Update: BankrCoin, Pippin surge as sector market cap steadies above $12B

The Artificial Intelligence (AI) segment is largely on the back foot with major coins such as Bittensor (TAO) and Internet Computer (ICP) extending losses amid a sticky risk-off sentiment.

Dollar drops and stocks rally: The week of reckoning for US economic data

Following a sizeable move lower in US technology Stocks last week, we have witnessed a meaningful recovery unfold. The USD Index is in a concerning position; the monthly price continues to hold the south channel support.

XRP holds $1.40 amid ETF inflows and stable derivatives market

Ripple trades under pressure, with immediate support at $1.40 holding at the time of writing on Tuesday. A recovery attempt from last week’s sell-off to $1.12 stalled at $1.54 on Friday, leading to limited price action between the current support and the resistance.