|

USD/MXN Price Analysis: Falling wedge lures Mexican Peso bears, focus on 16.80

  • USD/MXN portrays falling wedge bullish chart formation at the lowest levels since December 2015.
  • Gradually firmer RSI (14) favors gradual recovery of the Mexican Peso pair.
  • Convergence of 100-SMA, weekly resistance line appears a tough nut to crack for bulls.
  • Sellers could aim for late 2015 lows on breaking 16.67 support.

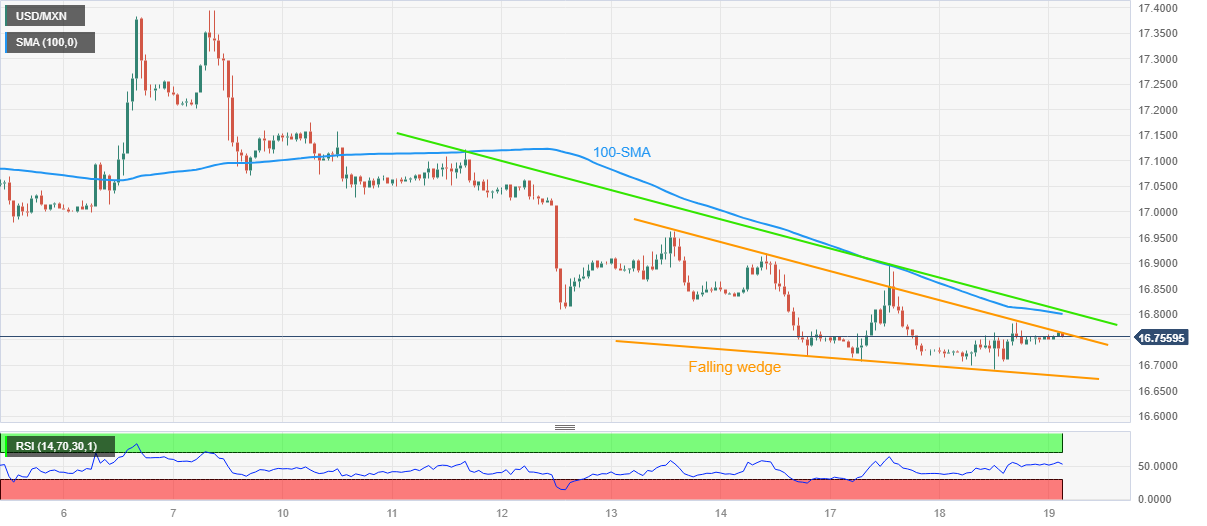
USD/MXN grind near intraday high as it prods the key upside hurdle within a bullish chart pattern during early Wednesday, close to 16.75 by the press time.

In doing so, the Mexican Peso (MXN) pair jostles with an upper line of a one-week-old falling wedge bullish formation.

Adding credence to the recovery hopes is the RSI (14) line that portrays higher lows, as well as mark the divergence with the price even when the USD/MXN dropped to a fresh low since December 2015.

With this, the USD/MXN pair is likely to confirm the falling wedge chart pattern by crossing the 16.76 hurdle, which in turn suggests a theoretical target of 17.03.

However, a convergence of the 100-SMA and a descending trend line from July 11, around 16.80 at the latest, appears a tough nut to crack for the pair buyers.

On the contrary, the latest multi-month low marked on Tuesday, around 16.69, precedes the stated wedge’s bottom line of near 16.67 to restrict the short-term downside of the USD/MXN pair.

Following that, the lows marked in December and November of 2015, respectively around 1647 and 16.35, will gain the Mexican Peso pair seller’s attention.

USD/MXN: Hourly chart

Trend: Limited recovery expected

Additional important levels

Overview
Today last price16.7548
Today Daily Change0.0038
Today Daily Change %0.02%
Today daily open16.751
 
Trends
Daily SMA2017.0304
Daily SMA5017.3112
Daily SMA10017.754
Daily SMA20018.5137
 
Levels
Previous Daily High16.783
Previous Daily Low16.6924
Previous Weekly High17.1746
Previous Weekly Low16.7167
Previous Monthly High17.7286
Previous Monthly Low17.0243
Daily Fibonacci 38.2%16.7484
Daily Fibonacci 61.8%16.727
Daily Pivot Point S116.7013
Daily Pivot Point S216.6515
Daily Pivot Point S316.6107
Daily Pivot Point R116.7919
Daily Pivot Point R216.8327
Daily Pivot Point R316.8825

Author

Anil Panchal

Anil Panchal

FXStreet

Anil Panchal has nearly 15 years of experience in tracking financial markets. With a keen interest in macroeconomics, Anil aptly tracks global news/updates and stays well-informed about the global financial moves and their implications.

More from Anil Panchal
Share:

Markets move fast. We move first.

Orange Juice Newsletter brings you expert driven insights - not headlines. Every day on your inbox.

By subscribing you agree to our Terms and conditions.

Editor's Picks

EUR/USD recovers to 1.1750 region as 2025 draws to a close

Following the bearish action seen in the European session on Wednesday, EUR/USD regains its traction and recovery to the 1.1750 region. Nevertheless, the pair's volatility remains low as trading conditions thin out on the last day of the year.

GBP/USD stays weak near 1.3450 on modest USD recovery

GBP/USD remains under modest beairsh pressure and fluctuates at around 1.3450 on Wednesday. The US Dollar finds fresh demand due to the end-of-the-year position adjustments, weighing on the pair amid the pre-New Year trading lull. 

Gold retreats to $4,300 area, looks to post monthly gains

Gold stays on the back foot on the last day of 2025 and trades near $4,300, possibly pressured by profit-taking and position adjustments. Nevertheless, XAU/USD remains on track to post gains for December and extend its winning streak into a fifth consecutive month.

Bitcoin, Ethereum and XRP prepare for a potential New Year rebound

Bitcoin, Ethereum, and Ripple are holding steady on Wednesday after recording minor gains on the previous day. Technically, Bitcoin could extend gains within a triangle pattern while Ethereum and Ripple face critical overhead resistance. 

Economic outlook 2026-2027 in advanced countries: Solidity test

After a year marked by global economic resilience and ending on a note of optimism, 2026 looks promising and could be a year of solid economic performance. In our baseline scenario, we expect most of the supportive factors at work in 2025 to continue to play a role in 2026.

Crypto market outlook for 2026

Year 2025 was volatile, as crypto often is.  Among positive catalysts were favourable regulatory changes in the U.S., rise of Digital Asset Treasuries (DAT), adoption of AI and tokenization of Real-World-Assets (RWA).