|

USD/MXN Price Analysis: Consolidates the biggest daily fall in two months above 200-SMA

  • USD/MXN pares heavy losses above the key moving average support, mildly bid of late.
  • Downside break of weekly support line favors intraday sellers of the Mexican Peso pair.
  • Bulls need validation from three-day-old descending resistance line, key Fibonacci retracement levels.
  • Further grinding toward the south can be expected amid mixed oscillators.

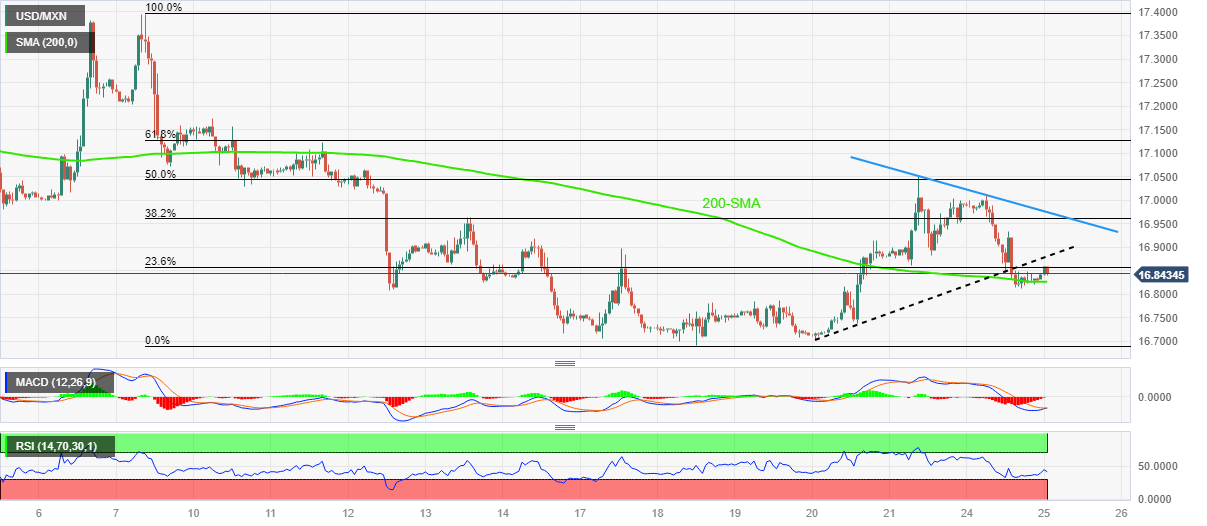
USD/MXN struggles to defend the previous corrective bounce off the 200-Hour Simple Moving Average (SMA) during early Tuesday morning in Asia, edges higher around 16.85 by the press time.

Although the 200-HMA restricts the immediate downside of the USD/MXN pair near 16.82, a clear downside break of the rising support line from July 20, now immediate resistance around 16.88, can prod the Mexican Peso (MXN) pair buyers.

It’s worth noting that the looming bull cross on the MACD defends the USD/MXN bulls amid a nearly oversold RSI (14) line.

That said, a successful break of the support-turned-resistance line, close to16.88 isn’t enough to convince the USD/MXN bulls as a downward-sloping resistance line from July 21, close to 16.98, quickly followed by the 17.00 round figure, can test the pair buyers.

Following that, a run-up toward the monthly high of around 17.40 can’t be ruled out.

On the flip side, a clear break of the 200-SMA support of near 16.82 becomes necessary to convince the USD/MXN sellers.

Even so, multiple levels marked since July 18 prod the pair bears around 16.78 before directing them to the late 2015 region tested the last week around 16.69.

USD/MXN: Hourly chart

Trend: Limited downside expected

Additional important levels

Overview
Today last price16.8428
Today Daily Change0.0125
Today Daily Change %0.07%
Today daily open16.8303
 
Trends
Daily SMA2016.9708
Daily SMA5017.2566
Daily SMA10017.7063
Daily SMA20018.4506
 
Levels
Previous Daily High17.0097
Previous Daily Low16.8129
Previous Weekly High17.0512
Previous Weekly Low16.6924
Previous Monthly High17.7286
Previous Monthly Low17.0243
Daily Fibonacci 38.2%16.888
Daily Fibonacci 61.8%16.9345
Daily Pivot Point S116.7589
Daily Pivot Point S216.6875
Daily Pivot Point S316.5621
Daily Pivot Point R116.9557
Daily Pivot Point R217.0811
Daily Pivot Point R317.1525

Author

Anil Panchal

Anil Panchal

FXStreet

Anil Panchal has nearly 15 years of experience in tracking financial markets. With a keen interest in macroeconomics, Anil aptly tracks global news/updates and stays well-informed about the global financial moves and their implications.

More from Anil Panchal
Share:

Editor's Picks

EUR/USD tumbles below 1.1800 as Middle East turmoil drives US Dollar demand

The EUR/USD pair falls to near 1.1770 during the early Asian session on Monday, pressured by a renewed US Dollar demand. The Greenback gathers strength against the Euro as the conflict across the Middle East is heightening traders' anxiety, boosting the safe-haven currencies. 

GBP/USD trims losses, retests 1.3460

After briefly challenging its key 200-day SMA near 1.3440, GBP/USD now manages to regain some balance and revisit the 1.3460 zone on Friday. Cable’s pullback comes as the selling pressure on the Greenback gathers traction, reigniting some recovery in the risk-linked space.

Gold seen through the roof as US, Israel and Iran war enters day 3

Gold is set for a huge bullish opening gap in Asian trading on Monday, with a flight to safety rush likely to sponsor the upsurge after the US and Israel struck Iran with heavy bombings over the weekend. More geopolitical headlines surrounding the Middle East conflict and Oil price movement remain in focus. 

Iran escalation: Quick thoughts on markets

Markets are likely to open the week with risk-off, with declines led by airlines, cyclicals and trade-exposed names, while energy, defense and “strategic” sectors may be relatively steadier.

Oil at a critical breakpoint: Will geopolitics trigger the next major move?

The week ahead blends two powerful forces: moderating economic momentum and increasing geopolitical tension. While US and Eurozone data suggest steady but unspectacular growth, rising friction between the US and Iran is injecting a fresh risk premium into energy markets. Macro is softening but geopolitics may dominate price action.

Starknet unveils strkBTC, shielded Bitcoin transactions on Ethereum Layer 2

Starknet, the Ethereum Layer 2 network developed by StarkWare, today announced strkBTC, a wrapped Bitcoin asset that introduces optional shielding while preserving full DeFi composability.