|

USD/MXN Price Analysis: Bulls appear well-set to cross 100-DMA hurdle around 19.00

  • USD/MXN remains sidelined after refreshing five-week top the previous day.
  • Upbeat oscillators, clear upside break of previous key resistance line keep Mexican Peso pair buyers hopeful.
  • Sellers need validation from 18.65 to retake control.

USD/MXN grinds near 18.90 as bulls take a breather after a three-day rebound from the multi-month low. Even so, the Mexican Peso (MXN) pair remains on the bull’s radar as it defends the previous day’s bullish signals.

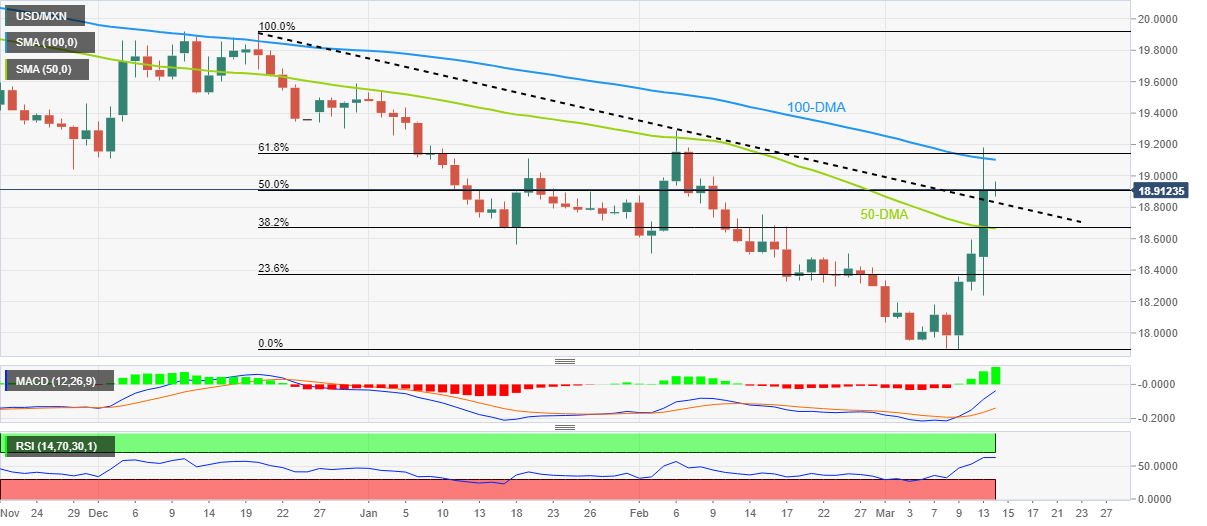
That said, a daily closing beyond a downward-sloping resistance line from late December 2022, now immediate support around 18.85, favors USD/MXN bulls. Adding strength to the upside bias is the bullish MACD signals and the firmer RSI (14) line, not overbought.

It should be noted that the USD/MXN pair failed to cross the 100-DMA hurdle, near 19.10 at the latest, during the previous day’s run-up. However, the aforementioned bullish catalysts hint at the pair’s sustained break of the key resistance.

Even so, the 61.8% Fibonacci retracement level of the pair’s December 2022 to March 2023 downside, close to 19.15, can act as an extra filter to the north. Following that, the previous monthly top surrounding 19.30 appears the last defense of the USD/MXN bears.

Meanwhile, the pair’s pullback moves appear unimpressive till staying beyond the aforementioned resistance-turned-support line near 18.85.

However, major attention should be given to a convergence of the 50-DMA and 38.2% Fibonacci retracement, near 18.65, to convince the USD/MXN bears to refresh the multi-month low marked the last week around 17.90.

USD/MXN: Daily chart

Trend: Further upside expected

Additional important levels

Overview
Today last price18.9015
Today Daily Change-0.0105
Today Daily Change %-0.06%
Today daily open18.912
 
Trends
Daily SMA2018.3351
Daily SMA5018.6751
Daily SMA10019.113
Daily SMA20019.6429
 
Levels
Previous Daily High19.1812
Previous Daily Low18.2397
Previous Weekly High18.5957
Previous Weekly Low17.8977
Previous Monthly High19.2901
Previous Monthly Low18.2954
Daily Fibonacci 38.2%18.8216
Daily Fibonacci 61.8%18.5994
Daily Pivot Point S118.3741
Daily Pivot Point S217.8361
Daily Pivot Point S317.4325
Daily Pivot Point R119.3156
Daily Pivot Point R219.7192
Daily Pivot Point R320.2571

Author

Anil Panchal

Anil Panchal

FXStreet

Anil Panchal has nearly 15 years of experience in tracking financial markets. With a keen interest in macroeconomics, Anil aptly tracks global news/updates and stays well-informed about the global financial moves and their implications.

More from Anil Panchal
Share:

Markets move fast. We move first.

Orange Juice Newsletter brings you expert driven insights - not headlines. Every day on your inbox.

By subscribing you agree to our Terms and conditions.

Editor's Picks

EUR/USD moves sideways below 1.1800 on Christmas Eve

EUR/USD struggles to find direction and trades in a narrow channel below 1.1800 after posting gains for two consecutive days. Bond and stock markets in the US will open at the usual time and close early on Christmas Eve, allowing the trading action to remain subdued. 

GBP/USD keeps range around 1.3500 amid quiet markets

GBP/USD keeps its range trade intact at around 1.3500 on Wednesday. The Pound Sterling holds the upper hand over the US Dollar amid pre-Christmas light trading as traders move to the sidelines heading into the holiday season. 

Gold retreats from record highs, trades below $4,500

Gold retreats after setting a new record-high above $4,520 earlier in the day and trades in a tight range below $4,500 as trading volumes thin out ahead of the Christmas break. The US Dollar selling bias remains unabated on the back of dovish Fed expectations, which continues to act as a tailwind for the bullion amid persistent geopolitical risks.

Bitcoin slips below $87,000 as ETF outflows intensify, whale participation declines

Bitcoin price continues to trade around $86,770 on Wednesday, after failing to break above the $90,000 resistance. US-listed spot ETFs record an outflow of $188.64 million on Tuesday, marking the fourth consecutive day of withdrawals.

Economic outlook 2026-2027 in advanced countries: Solidity test

After a year marked by global economic resilience and ending on a note of optimism, 2026 looks promising and could be a year of solid economic performance. In our baseline scenario, we expect most of the supportive factors at work in 2025 to continue to play a role in 2026.

Avalanche struggles near $12 as Grayscale files updated form for ETF

Avalanche trades close to $12 by press time on Wednesday, extending the nearly 2% drop from the previous day. Grayscale filed an updated form to convert its Avalanche-focused Trust into an ETF with the US Securities and Exchange Commission.