|

USD/MXN Price Analysis: Bears flirt with 17.80 confluence resistance-turned-support

  • USD/MXN oscillates in a narrow trading band near a one-week trough touched on Wednesday.
  • The mixed technical setup warrants caution for bears and before positioning for deeper losses.
  • A sustained strngth beyond the 38.2% Fibo. level will set the stage for some maningful upside. 

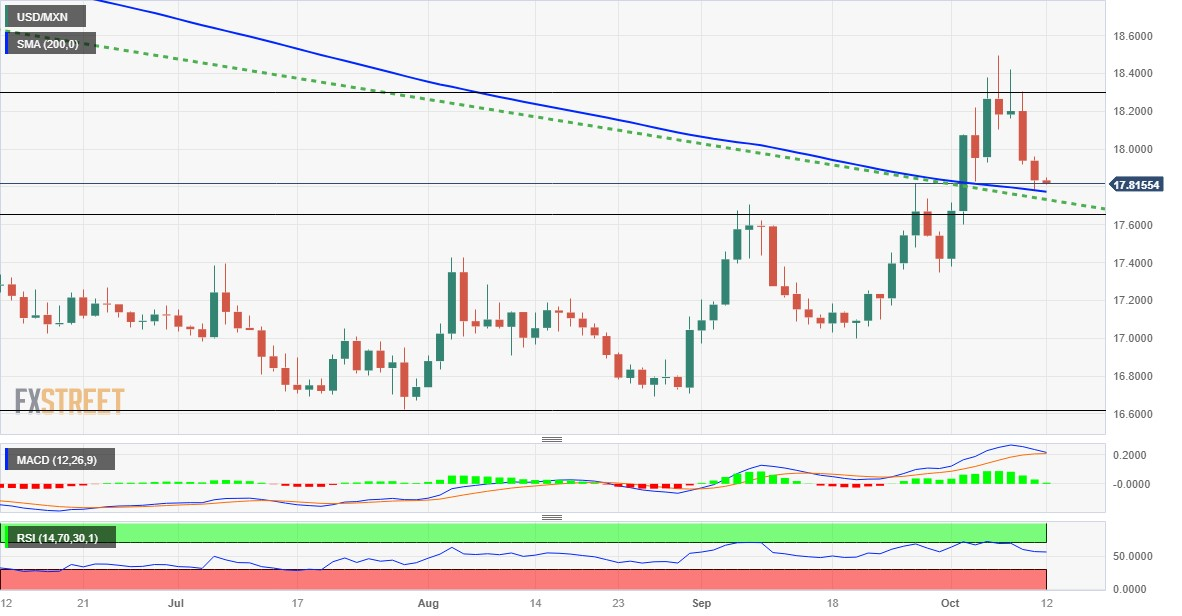
The USD/MXN pair trades on the backfoot during the Asian session on Wednesday and consolidates its recent losses to over a one-week low touched the previous day. Spot prices currently trade around the 17.80 region, down 0.10% for the day, flirting with a confluence resistance breakpoint comprising the 200-day Simple Moving Average (SMA) and a multi-month-old descending trend-line.

Meanwhile, technical indicators on the daily chart have been retreating from higher levels, though manage to hold in the positive territory. This makes it prudent to wait for a convincing break below the aforementioned resistance-turned-support before positioning for an extension of the recent pullback from mid-18.00s, or the highest level since late March touched last week. Some follow-through selling below the 17.65 zone, representing the 23.6% Fibonacci retracement level of the fall witnessed in July, will shift the near-term bias for the USD/MXN pair back in favour of bearish traders.

Spot prices might then accelerate the fall to the 17.40-17.35 horizontal support before dropping further towards the 17.15-17.10 intermediate support. The downward trajectory could get extended and drag the USD/MXN pair to the 16.90-16.85 area and the multi-year low, around the 16.65-16.60 region touched in July.

On the flip side, the 18.00 round figure now seems to act as an immediate hurdle ahead of the 18.15-18.20 zone. This is followed by 38.2% Fibo., around the 18.30 region and mid-18.00s, or the monthly. A sustained strength beyond will set the stage for the resumption of the recent appreciating move witnessed over the past month or so and lift the USD/MXN pair to the 18.80-18.85 area, representing 50% Fibo. level.

USD/MXN daily chart

fxsoriginal

Techincal levels to watch

USD/MXN

Overview
Today last price17.8166
Today Daily Change-0.0178
Today Daily Change %-0.10
Today daily open17.8344
 
Trends
Daily SMA2017.5817
Daily SMA5017.2943
Daily SMA10017.2124
Daily SMA20017.7823
 
Levels
Previous Daily High17.9596
Previous Daily Low17.7861
Previous Weekly High18.4934
Previous Weekly Low17.3786
Previous Monthly High17.8174
Previous Monthly Low16.9727
Daily Fibonacci 38.2%17.8524
Daily Fibonacci 61.8%17.8934
Daily Pivot Point S117.7605
Daily Pivot Point S217.6866
Daily Pivot Point S317.587
Daily Pivot Point R117.934
Daily Pivot Point R218.0336
Daily Pivot Point R318.1075

Author

Haresh Menghani

Haresh Menghani is a detail-oriented professional with 10+ years of extensive experience in analysing the global financial markets.

More from Haresh Menghani
Share:

Editor's Picks

EUR/USD trims losses, flirts with the 1.1850 zone

EUR/USD is back on the back foot on Wednesday, slipping below the 1.1850 area as the US Dollar picks up some modest traction. The move comes as traders position ahead of a busy run of US data and the release of the FOMC Minutes. Adding to the pullback are reports that the ECB’s Lagarde may step down before completing her term.

GBP/USD flirts with daily highs near 1.3580

GBP/USD manages to set aside two consecutive daily declines and trades with slight gains in the 1.3580 zone on Wednesday. Cable’s uptick comes despite acceptable gains in the Greenback and easing UK inflation figures, which seem to have reinforced the case for a BoE rate cut in March.

Gold regains some shine, retargets $5,000 ahead of FOMC Minutes

Gold gathers fresh upside traction on Wednesday, leaving part of the weakness seen at the beginning of the week and refocusing its attention to the key $5,000 mark per troy ounce, all ahead of the release of the FOMC Minutes and despite the modest uptick in the US Dollar.

Pi Network rally defies market pressure ahead of its first anniversary

Pi Network is trading above $0.1900 at press time on Wednesday, extending the weekly gains by nearly 8% so far. The steady recovery is supported by a short-term pause in mainnet migration, which reduces pressure on the PI token supply for Centralized Exchanges. The technical outlook focuses on the $0.1919 resistance as bullish momentum increases.

Mixed UK inflation data no gamechanger for the Bank of England

Food inflation plunged in January, but service sector price pressure is proving stickier. We continue to expect Bank of England rate cuts in March and June. The latest UK inflation read is a mixed bag for the Bank of England, but we doubt it drastically changes the odds of a March rate cut.

Top 3 Price Prediction: Bitcoin, Ethereum, and Ripple face downside risk as bears regain control

Bitcoin, Ethereum, and Ripple remain under pressure on Wednesday, with the broader trend still sideways. BTC is edging below $68,000, nearing the lower consolidating boundary, while ETH and XRP also declined slightly, approaching their key supports.