|

USD/MXN hits a three-week low as the greenback slides despite solid US Consumer data

  • USD/MXN falls as the US Dollar weakens across the board.
  • US Consumer confidence improved but failed to underpin the US Dollar.
  • USD/MXN Price Analysis: Remains downward biased but could shift neutral above 18.50.

USD/MXN dropped and extended its losses to a three-week low in early trading during the New York session. US equities are mixed, while the greenback continues to tumble as market expectations for a rate cut in 2023 persist. Therefore, the USD/MXN s trading at 18.2631 after hitting a high of 18.3573.

CB Consumer Confidence exceeded estimates, but the US Dollar didn’t blink

Traders’ sentiments remain fragile. Economic data in the United States (US) was mixed, with the Conference Board (CB) Consumer Confidence rising to 104.2 from 103.4 in February. “Driven by an uptick in expectations, consumer confidence improved somewhat in March but remains below the average level seen in 2022,” said Ataman Ozyildirim, senior director of economics at the Conference Board.

Further details of the survey revealed that the Present Situation Index declined to 151.1 from 153, and the Consumer Expectations Index rose to 74 from 70.4

In early data, the House Price Index rose 0.2% MoM in January vs. a drop of 0.6% estimated, data showed from the US Federal Housing Finance Agency showed on Tuesday. At the same time, the S&P/Case-Shiller Home Price Index arrived at 2.5% on a yearly basis in January, down from 4.6% in the prior month.

USD/MXN traders ignored most US data. Consumer confidence improvement barely moved the pair, which is still pushing lower, with sellers eyeing 18.20. The US Dollar Index (DXY), a gauge of the buck’s value vs. a basket of peers, tumbles 0.30%, at 102.518

US Treasury bond yields are recovering some ground, with 2s gaining four bps at 4.039%. The 10-year benchmark note rate is at 3.556%.

On the Mexican front, the lack of data keeps traders leaning on sentiment and expectations for a 25 bps rate hike by Banxico (Bank of Mexico) on March 30. That would lift rates from 11% to 11.25%.

USD/MXN Technical analysis

USD/MXN Daily chart

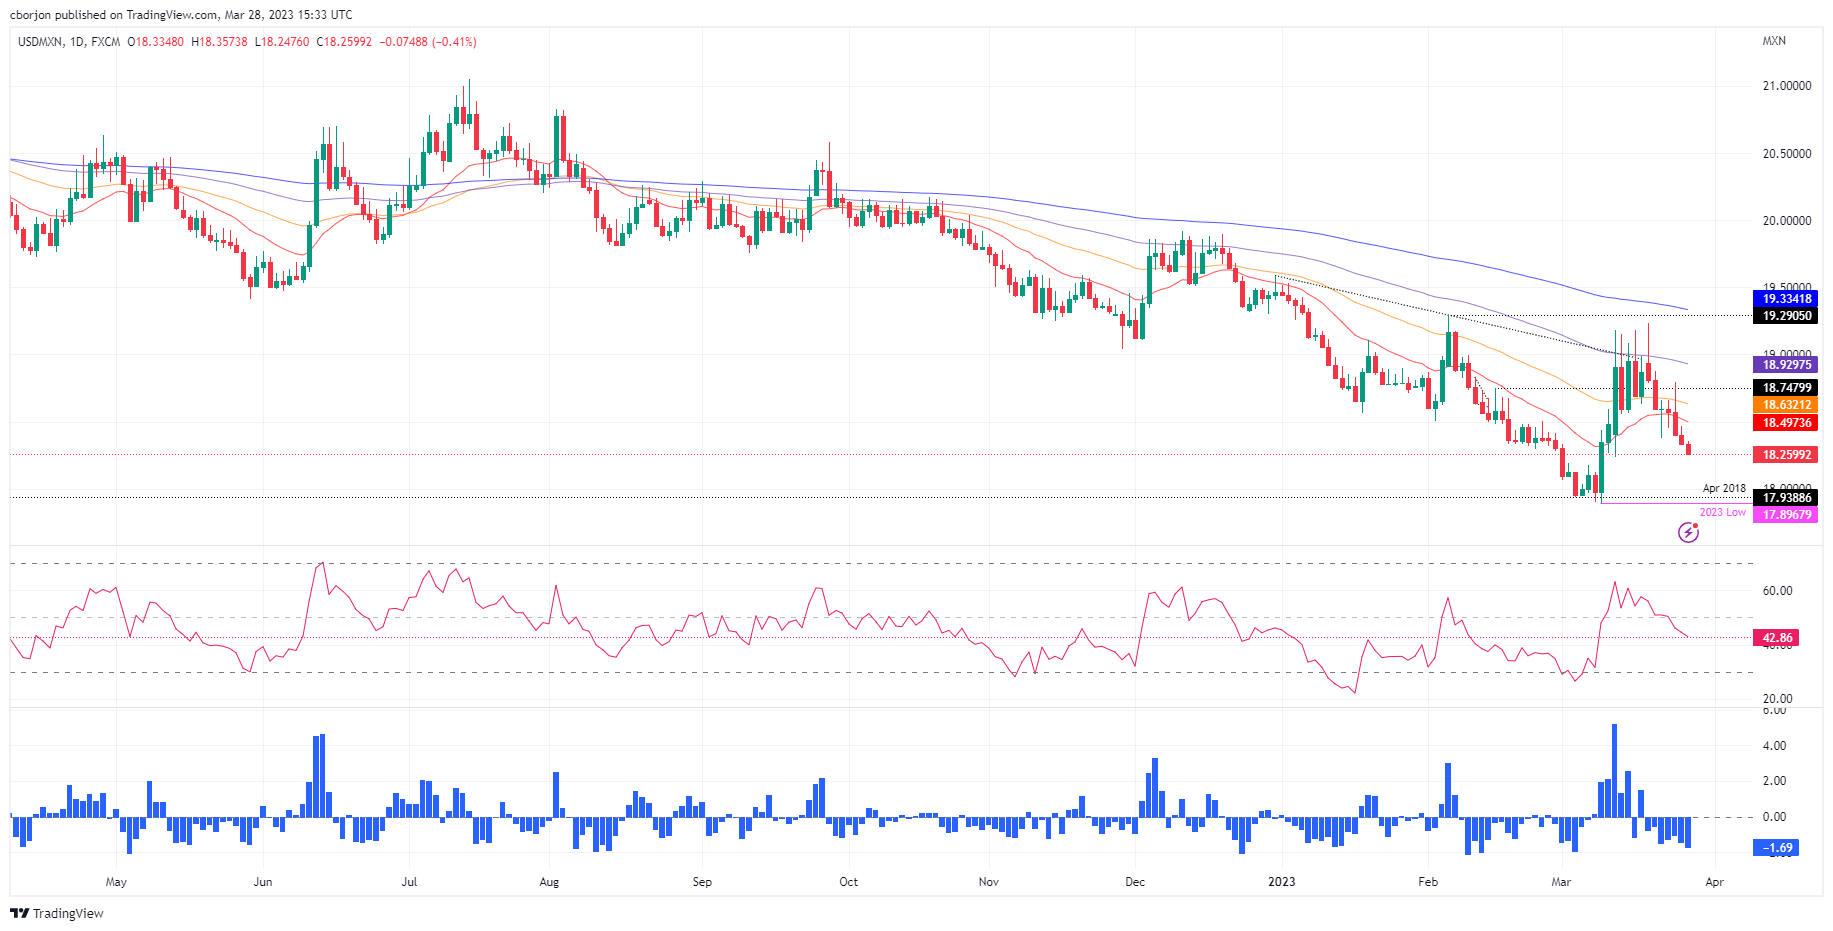
The USD/MXN remains downward biased after briefly testing the 19.00 mark after the banking crisis in the US. Since then, the USD/MXN pair dropped below the 50 and 20-day Exponential Moving Averages (EMAs), setting the stage for further downside. The Relative Strength Index (RSI) and the Rate of Change (RoC) suggest that sellers gather momentum. That said, the USD/MXN first support would be 18.0000, followed by the YTD low at 17.8967. In an alternate scenario, and the less likely to occur, if buyers reclaim 18.5000, that would exacerbate a rally to 19.0000.

USD/MXN

Overview
Today last price18.2589
Today Daily Change-0.0901
Today Daily Change %-0.49
Today daily open18.349
 
Trends
Daily SMA2018.4459
Daily SMA5018.5906
Daily SMA10019.0059
Daily SMA20019.5699
 
Levels
Previous Daily High18.4681
Previous Daily Low18.3269
Previous Weekly High19.2324
Previous Weekly Low18.3797
Previous Monthly High19.2901
Previous Monthly Low18.2954
Daily Fibonacci 38.2%18.3808
Daily Fibonacci 61.8%18.4142
Daily Pivot Point S118.2945
Daily Pivot Point S218.2401
Daily Pivot Point S318.1533
Daily Pivot Point R118.4358
Daily Pivot Point R218.5226
Daily Pivot Point R318.5771

Author

Christian Borjon Valencia

Markets analyst, news editor, and trading instructor with over 14 years of experience across FX, commodities, US equity indices, and global macro markets.

More from Christian Borjon Valencia
Share:

Editor's Picks

AUD/USD holds the bounce near 0.7050 after China trade data

AUD/USD is holding the bounce from two-month lows, retesting 0.7050 in the Asian session on Tuesday. Easing tensions in the Middle East keep the US Dollar on the defensive, supporting the pair amid China's trade surplus expansion in May.

USD/JPY consolidates above 160.00 amid intervention fears, Israel-Iran ceasefire

USD/JPY holds steady above 160.00 during the Asian session on Tuesday as expectations that authorities will step in again to prop up the Japanese Yen hold back bulls from placing fresh bets. Moreover, a de-escalation of tensions between Israel and Iran undermines the safe-haven US Dollar, capping the currency pair. Traders also seem hesitant and opt to wait for the release of the latest US inflation figures on Wednesday and Thursday.

Gold rebounds but not out of the woods yet

Gold holds the rebound above $4,300 early Tuesday after hitting three-month lows at $4,269. The US Dollar eases amid doubts over the Mideast truce situation, traders cash in ahead of Wednesday’s US CPI. Downside risks remain intact for Gold whilst below the 200-day SMA and amid bearish daily RSI.

XRP and XLM outlook: Fragile recovery as traders favor downside

Ripple and Stellar remain under pressure on Tuesday after a mild recovery following a massive correction in the previous week. Weakening derivatives positioning, alongside mixed on-chain data for both XRP and XLM, suggests that any recovery rallies are likely viewed as corrective within a broader bearish context. Derivatives data shows a bearish tilt.

The market dodged the Oil shock, but the rate trap is still set

Monday’s bounce was relief, not confirmation. Oil backed away from the geopolitical cliff, tech found a bid, and risk assets stabilized, but the late-day fade showed that conviction remains thin. The real threat is no longer just Middle East escalation.

The US economy defies the rules: 100 days into the Oil shock and the recession signal is still missing

More than three months after the start of the Iran war and the resulting disruption to global energy markets, the US economy continues to display remarkable resilience. The conflict has triggered a sharp rise in Oil prices, reignited inflationary pressures and fueled widespread concerns about a potential economic slowdown.