|

USD/MXN falls to lows since 2015 following US Core CPI

  • USD/MXN printed a fresh cycle low on Friday of 16.62 and is poised to close a 1.70% weekly loss.
  • Core US CPI retreated to 4.1% YoY in June.
  • Falling US yields limit the Greenback’s advance as markets start to place bets on the September meeting.

On Friday, the USD/MXN pair fell to its lowest point since December 2015, this time weakened but soft Core Personal Consumption Expenditures (PCE) figure from June.

In that sense, the figures, which act as an essential gauge of inflation for the Federal Reserve (Fed), dropped to 4.1% YoY in June, lower than the 4.2% expected and the previous 4.6%. Its worth noticing that regarding September’s meeting, Jerome Powell added that the Fed can pause or hike and will depend solely on the data, so soft inflation figures make a case for a pause stronger, making the US yields decrease across the board.

However, the economic outlook from the US is strong as on Thursday, positive Q2 Gross Domestic Product (GDP) was reported, along with robust Durable Goods and Jobless Claims data. That being said, the next two set of inflation and job report figures before the Federal Open Market Committee (FOMC) meeting will be the ones which model the tightening expectations.

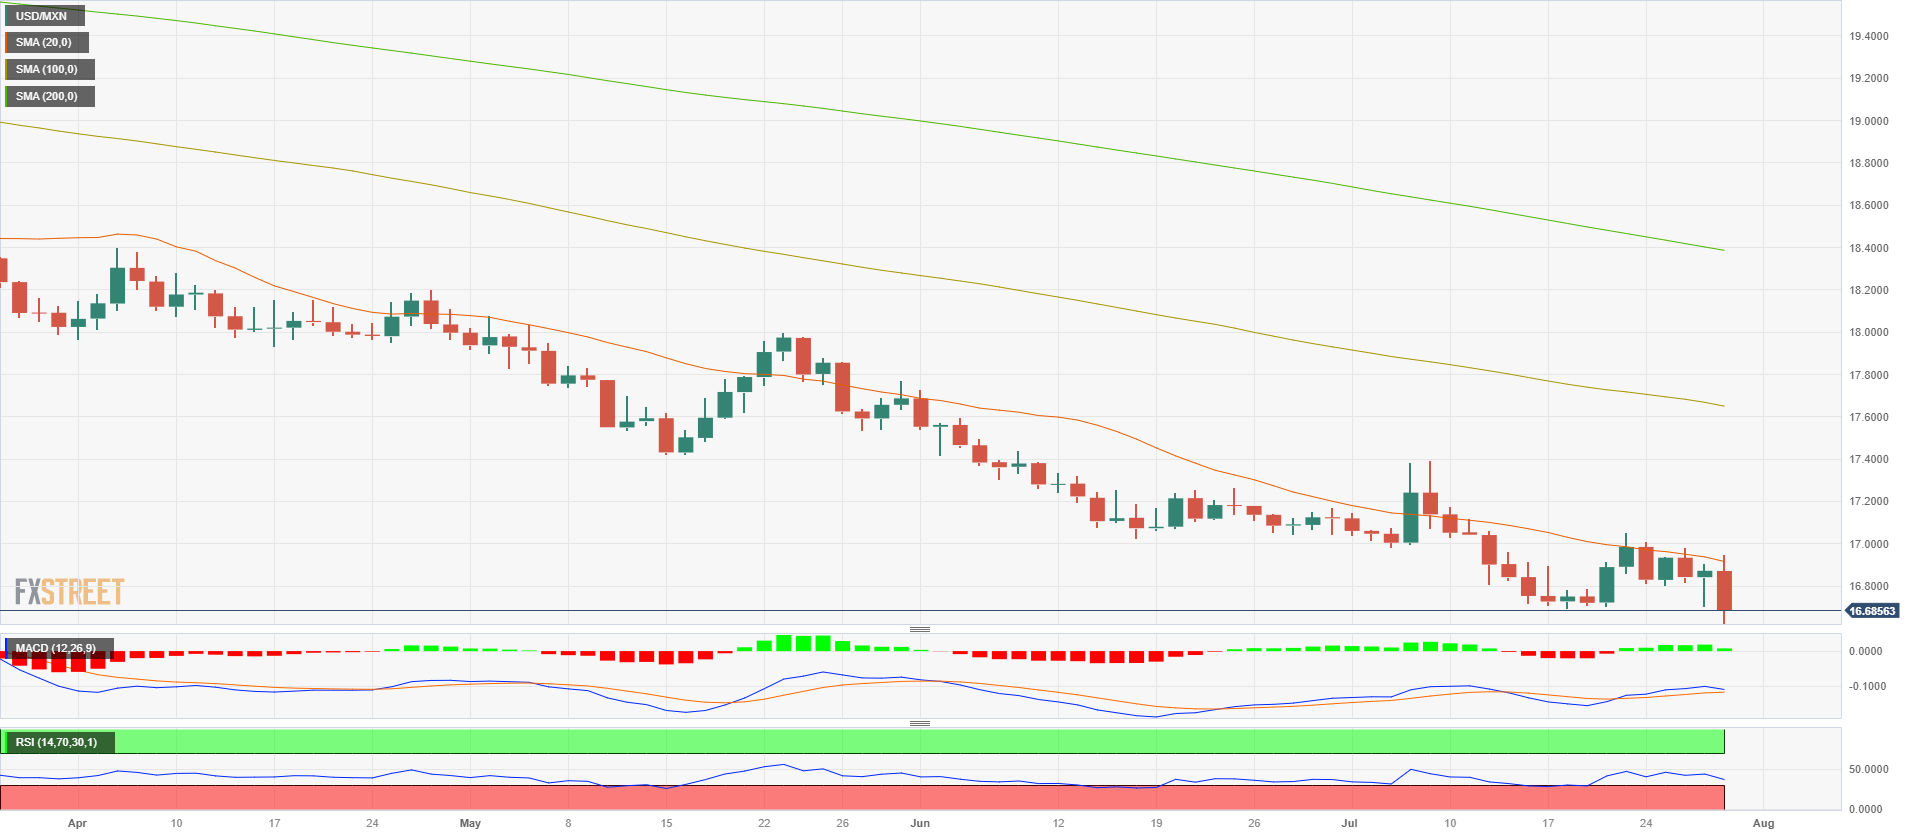
USD/MXN Levels to watch

The daily and weekly charts show that the technical outlook is bearish. On the daily chart, the Relative Strength Index (RSI) and the Moving Average Convergence Divergence (MACD) hint at the bears holding strong momentum while the pair trades below the 20,100 and 200-day Simple Moving Averages (SMA).

Support levels: 16.60, 16.50, 16.30.
Resistance levels: 16.90 (20-day SMA), 17.00, 17.20.

USD/MXN

Overview
Today last price16.6785
Today Daily Change-0.1939
Today Daily Change %-1.15
Today daily open16.8724
 
Trends
Daily SMA2016.9381
Daily SMA5017.2133
Daily SMA10017.6686
Daily SMA20018.403
 
Levels
Previous Daily High16.9084
Previous Daily Low16.7037
Previous Weekly High17.0512
Previous Weekly Low16.6924
Previous Monthly High17.7286
Previous Monthly Low17.0243
Daily Fibonacci 38.2%16.8302
Daily Fibonacci 61.8%16.7819
Daily Pivot Point S116.748
Daily Pivot Point S216.6235
Daily Pivot Point S316.5433
Daily Pivot Point R116.9527
Daily Pivot Point R217.0329
Daily Pivot Point R317.1573

Author

Patricio Martín

Patricio is an economist from Argentina passionate about global finance and understanding the daily movements of the markets.

More from Patricio Martín
Share:

Markets move fast. We move first.

Orange Juice Newsletter brings you expert driven insights - not headlines. Every day on your inbox.

By subscribing you agree to our Terms and conditions.

Editor's Picks

EUR/USD bounces toward 1.1750 as US Dollar loses strength

EUR/USD returned to the 1.1750 price zone in the American session on Friday, despite falling Wall Street, which indicates risk aversion. Trading conditions remain thin following the New Year holiday and ahead of the weekend, with the focus shifting to US employment and European data scheduled for next week.

GBP/USD nears 1.3500, holds within familiar levels

After testing 1.3400 on the last day of 2025, GBP/USD managed to stage a rebound. Nevertheless, the pair finds it difficult to gather momentum and trades with modest intraday gains at around 1.3490 as market participants remain in holiday mood.

Gold trims intraday gains, approaches $4,300

Gold retreated sharply from the $4,400  area and trades flat for the day in the $4,320 price zone. Choppy trading conditions exacerbated the intraday decline, although XAU/USD bearish case is out of the picture, considering growing expectations for a dovish Fed and persistent geopolitical tensions.

Cardano gains early New Year momentum, bulls target falling wedge breakout

Cardano kicks off the New Year on a positive note and is extending gains, trading above $0.36 at the time of writing on Friday. Improving on-chain and derivatives data point to growing bullish interest, while the technical outlook keeps an upside breakout in focus.

Economic outlook 2026-2027 in advanced countries: Solidity test

After a year marked by global economic resilience and ending on a note of optimism, 2026 looks promising and could be a year of solid economic performance. In our baseline scenario, we expect most of the supportive factors at work in 2025 to continue to play a role in 2026.

Crypto market outlook for 2026

Year 2025 was volatile, as crypto often is.  Among positive catalysts were favourable regulatory changes in the U.S., rise of Digital Asset Treasuries (DAT), adoption of AI and tokenization of Real-World-Assets (RWA).