|

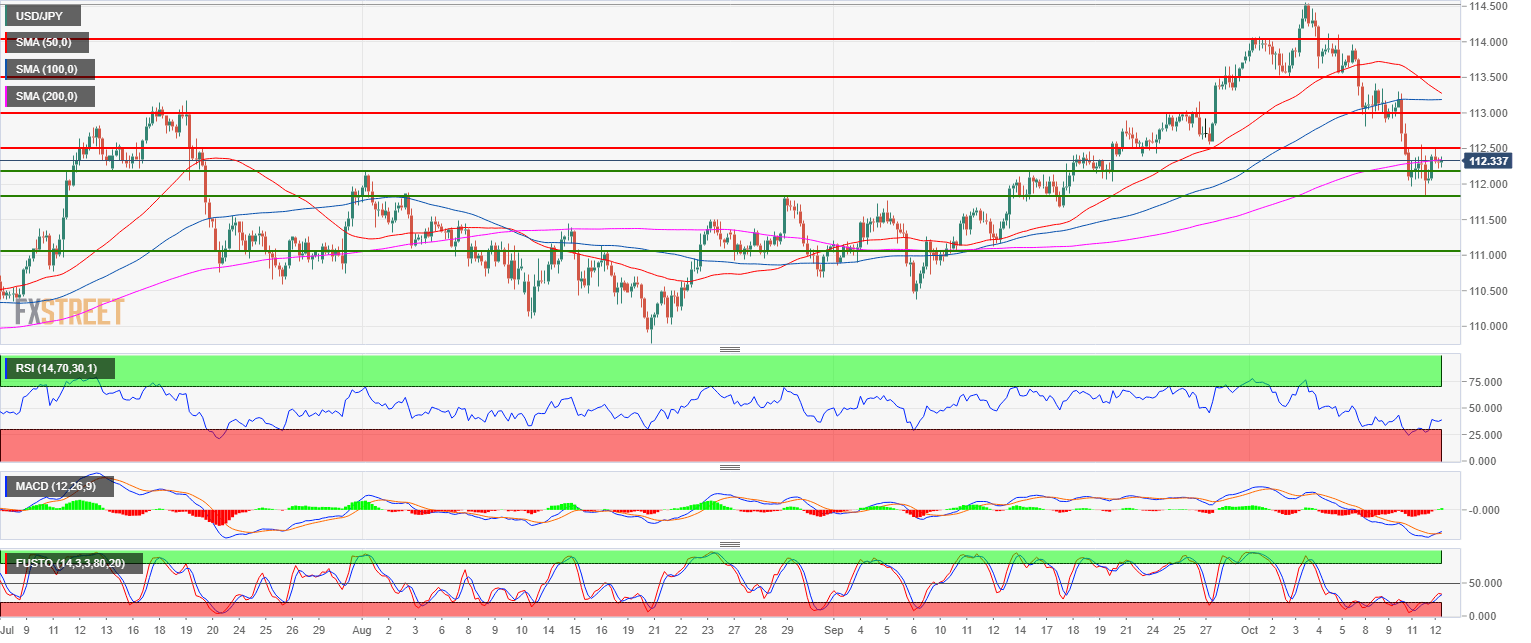
USD/JPY Technical Analysis: The bearish pullback might have run its course as Greenback bulls are holding the market above 112.00 figure

  • USD/JPY is in a bullish trend and had a pullback down to the 200-period simple moving average on the 4-hour chart and the 50-day simple moving average (not shown). 
  • USD/JPY is currently trying to stabilize above the 112.00 level as bulls might potentially launch a new bull run from there. The RSI is still below 50 suggesting weak bullish momentum while the MACD and Stochastic are slowly rising which is encouraging for bulls. Resistances to the upside can be located near 112.55 (September 27 low) and 113.00.
  • However, a strong bear breakout below 111.84 (August 29 swing high) on a daily closing basis would likely invalidate the bullish bias.

USD/JPY 4-hour chart

Spot rate:                         112.31
Relative change:             -0.32%     
High:                                112.51
Low:                                 112.00

Main trend:               Bullish

Resistance 1:    112.55 September 27 low
Resistance 2:    113.00 figure
Resistance 3:    113.55 October 2 low
Resistance 4:    113.55 October 2 low
Resistance 5:    114.00 figure
Resistance 6:    114.80 November 2017 high
Resistance 7:    115.50 March 10, 2017 high 

Support 1:    112.00-112.17 zone, figure and August 1 swing high
Support 2:    111.84 August 29 swing high
Support 3:    111.00 figure

Author

Flavio Tosti

Flavio Tosti

Independent Analyst


More from Flavio Tosti
Share:

Editor's Picks

EUR/USD revisits 1.1780, or daily lows

EUR/USD now comes under further selling pressure, breaking below the 1.1800 support to reach daily troughs on Thursday. The pair’s decline comes in response to a sudden bout of USD strength amid steady geopolitical tensions. Ealier in the day, the ECB’s Lagarde delivered cautious remarks, although the currency remained apathetic.

GBP/USD makes a U-turn, challenges 1.3500

GBP/USD rapidly leaves behind Wednesday’s strong advance, putting the 1.3500 support to the test on Thursday. Cable’s deep pullback follows the strong gains in the Greenback, while investors continue to pencil in a potential BoE rate cut in March.

Gold sticks to the bid bias, flirts with $5,200

Gold is now facing some downside pressure, hovering around the $5,170 region on Thursday. The precious metal adds to Wednesday’s optimism despite the Greenback trades in a firm fashion, although geopolitical tensions in the Middle East keep the yellow metal bid for now.

Stellar: Relief bounce fades as bearish undertone persists

Stellar is trading around $0.16 at the time of writing on Thursday after rebounding more than 8% in the previous day. Derivatives data paints a negative picture as XLM’s short bets hit a monthly high while Open Interest continues to decline.

The one thing everyone is on the lookout for is US action of some sort against Iran

The FX market is minestrone soup these days. It is befuddled by conflicting data, rumors and small stories exaggerated out of proportion, and Trump-generated uncertainty. 

Bitcoin steadies as traders eye US–Iran talks

Bitcoin (BTC) price is stabilizing around $68,000 at the time of writing on Thursday after a 6.2% relief rally the previous day amid a broader downward trend.