|

USD/JPY technical analysis: Greenback struggles to regain the 108.00 handle

  • USD/JPY is in search of a clear direction as the market is having a hard time to regain the 108.00 handle. 
  • The level to beat for bears is the 107.80 support level.
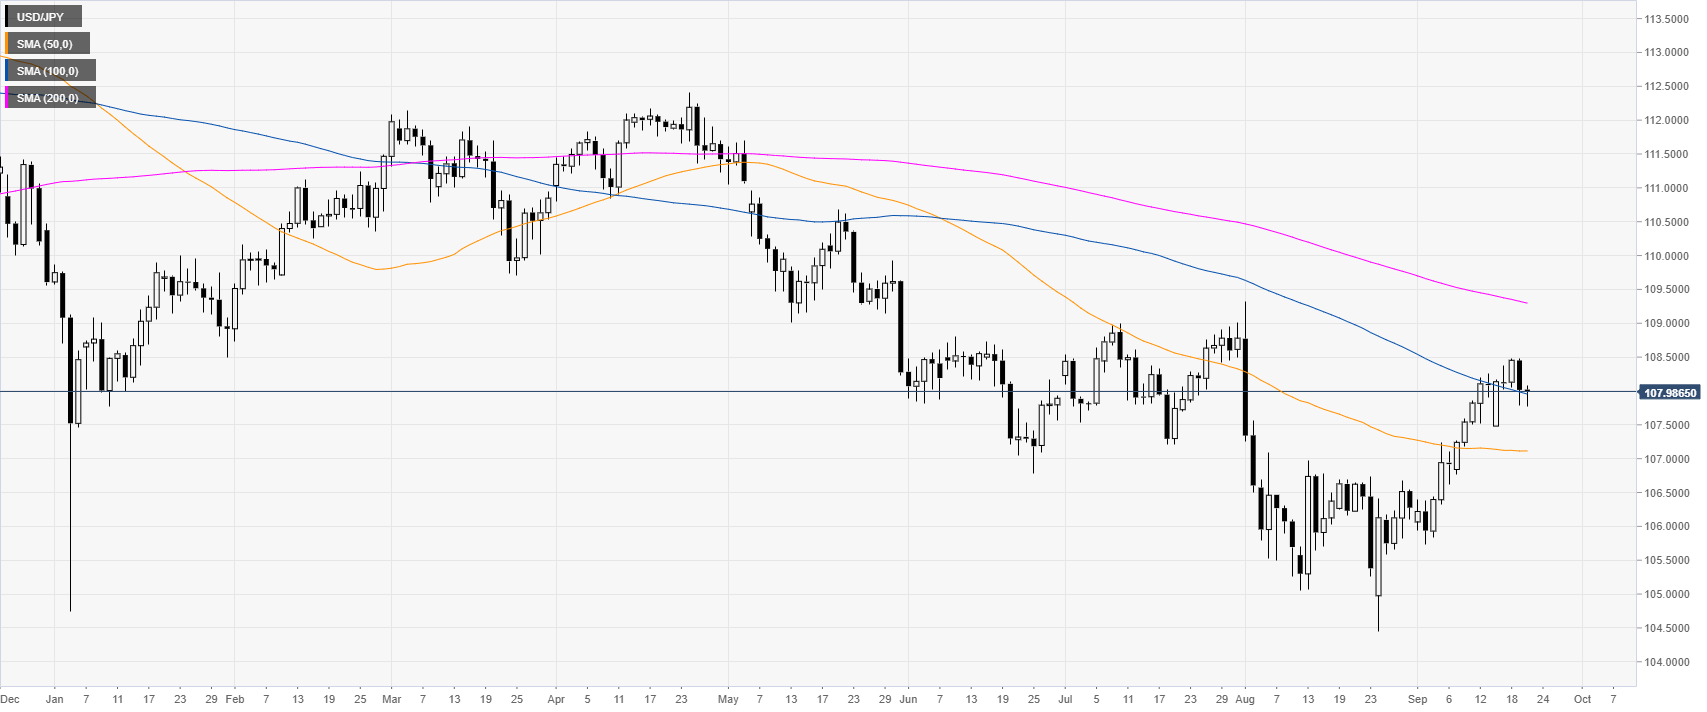
 

USD/JPY daily chart


USD/JPY is trading in a bear trend below its 200-day simple moving averages (SMA). However, this September, USD/JPY is gaining strength now challenging the 100 SMA and the 108.00 handle. 


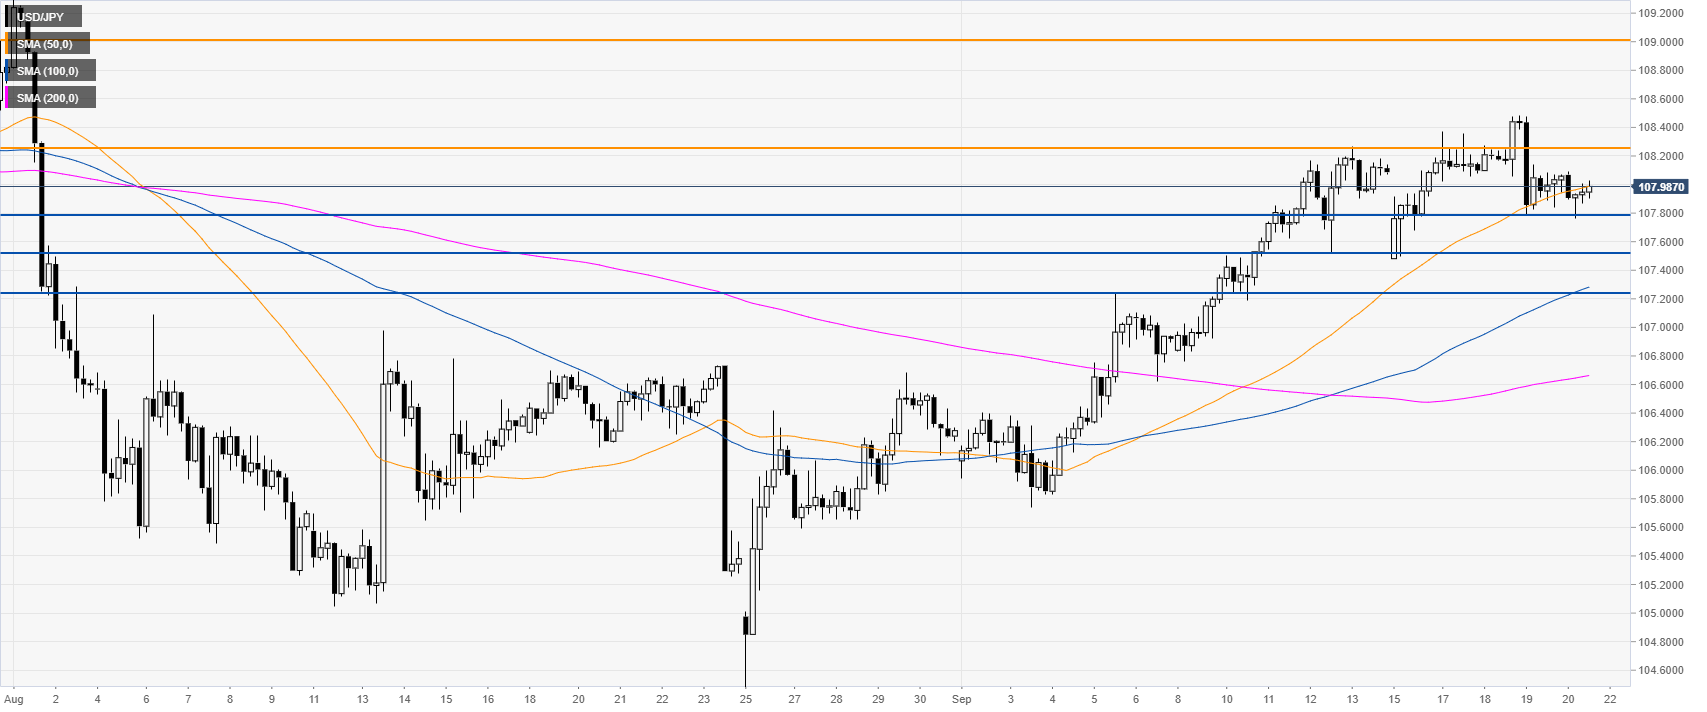
USD/JPY 4-hour chart


USD/JPY is trading between the 50 and 100 SMAs, suggesting a consolidation in the medium term. The market is trading above the 107.80 support with little bullish conviction as the 50 SMA is capping gains. 
 

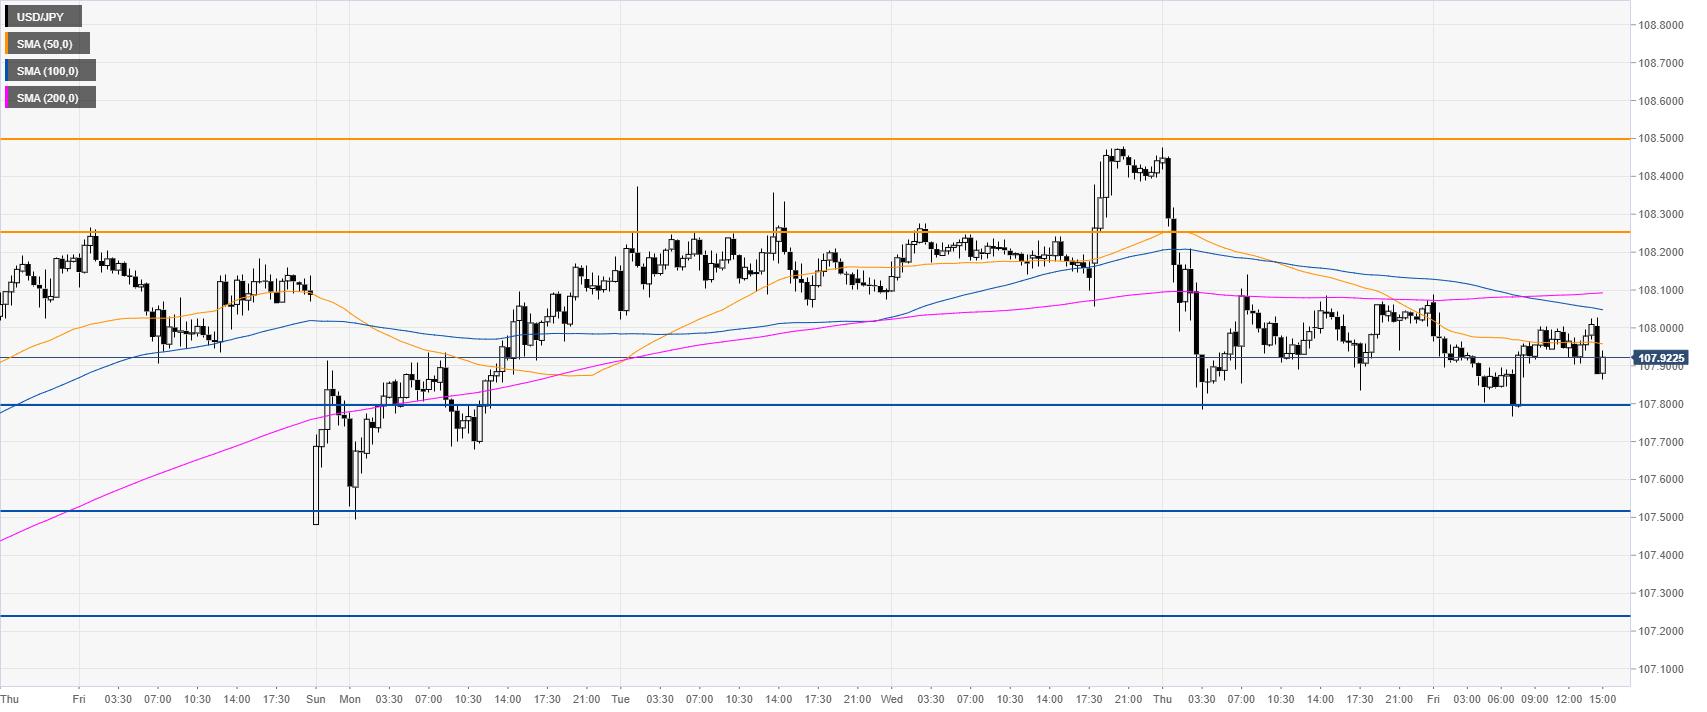
USD/JPY 30-minute chart


Dollar/Yen has been trading in a range for the last six days. The drop on Thursday was sharp and bulls will have to bring the market back above the 108.50 level in order to attract more buyers. On the flip side, a daily close below 107.80 could open the gates to further losses towards 107.50 and 107.25, according to the Technical Confluences Indicator
 

Additional key levels

USD/JPY

Overview
Today last price107.88
Today Daily Change-0.14
Today Daily Change %-0.13
Today daily open108.02
 
Trends
Daily SMA20107
Daily SMA50107.11
Daily SMA100107.99
Daily SMA200109.32
 
Levels
Previous Daily High108.48
Previous Daily Low107.78
Previous Weekly High108.26
Previous Weekly Low106.76
Previous Monthly High109.32
Previous Monthly Low104.45
Daily Fibonacci 38.2%108.05
Daily Fibonacci 61.8%108.21
Daily Pivot Point S1107.71
Daily Pivot Point S2107.4
Daily Pivot Point S3107.02
Daily Pivot Point R1108.4
Daily Pivot Point R2108.78
Daily Pivot Point R3109.09

Author

Flavio Tosti

Flavio Tosti

Independent Analyst


More from Flavio Tosti
Share:

Editor's Picks

EUR/USD tests nine-day EMA support near 1.1850

EUR/USD remains in the negative territory for the fourth successive session, trading around 1.1870 during the Asian hours on Friday. The 14-day Relative Strength Index momentum indicator at 56 stays above the midline, confirming steady momentum. RSI has eased but remains above 50, indicating momentum remains constructive for the bulls.

GBP/USD consolidates around 1.3600 vs. USD; looks to US CPI for fresh impetus

The GBP/USD pair remains on the defensive through the Asian session on Friday, though it lacks bearish conviction and holds above the 1.3600 mark as traders await the release of the US consumer inflation figures before placing directional bets.

Gold recovers swiftly from weekly low, climbs back closer to $5,000 ahead of US CPI

Gold regains positive traction during the Asian session on Friday and recovers a part of the previous day's heavy losses to the $4,878-4,877 region, or the weekly low. The commodity has now moved back closer to the $5,000 psychological mark as traders keenly await the release of the US consumer inflation figures for more cues about the Federal Reserve's policy path.

Solana: Mixed market sentiment caps recovery

Solana is trading at $79 as of Friday, following a correction of over 9% so far this week. On-chain and derivatives data indicates mixed sentiment among traders, further limiting the chances of a price recovery.

A tale of two labour markets: Headline strength masks underlying weakness

Undoubtedly, yesterday’s delayed US January jobs report delivered a strong headline – one that surpassed most estimates. However, optimism quickly faded amid sobering benchmark revisions.

Solana Price Forecast: Mixed market sentiment caps recovery

Solana (SOL) is trading at $79 as of Friday, following a correction of over 9% so far this week. On-chain and derivatives data indicates mixed sentiment among traders, further limiting the chances of a price recovery.