|

USD/JPY Technical Analysis: Greenback sliding down near 110.00 handle
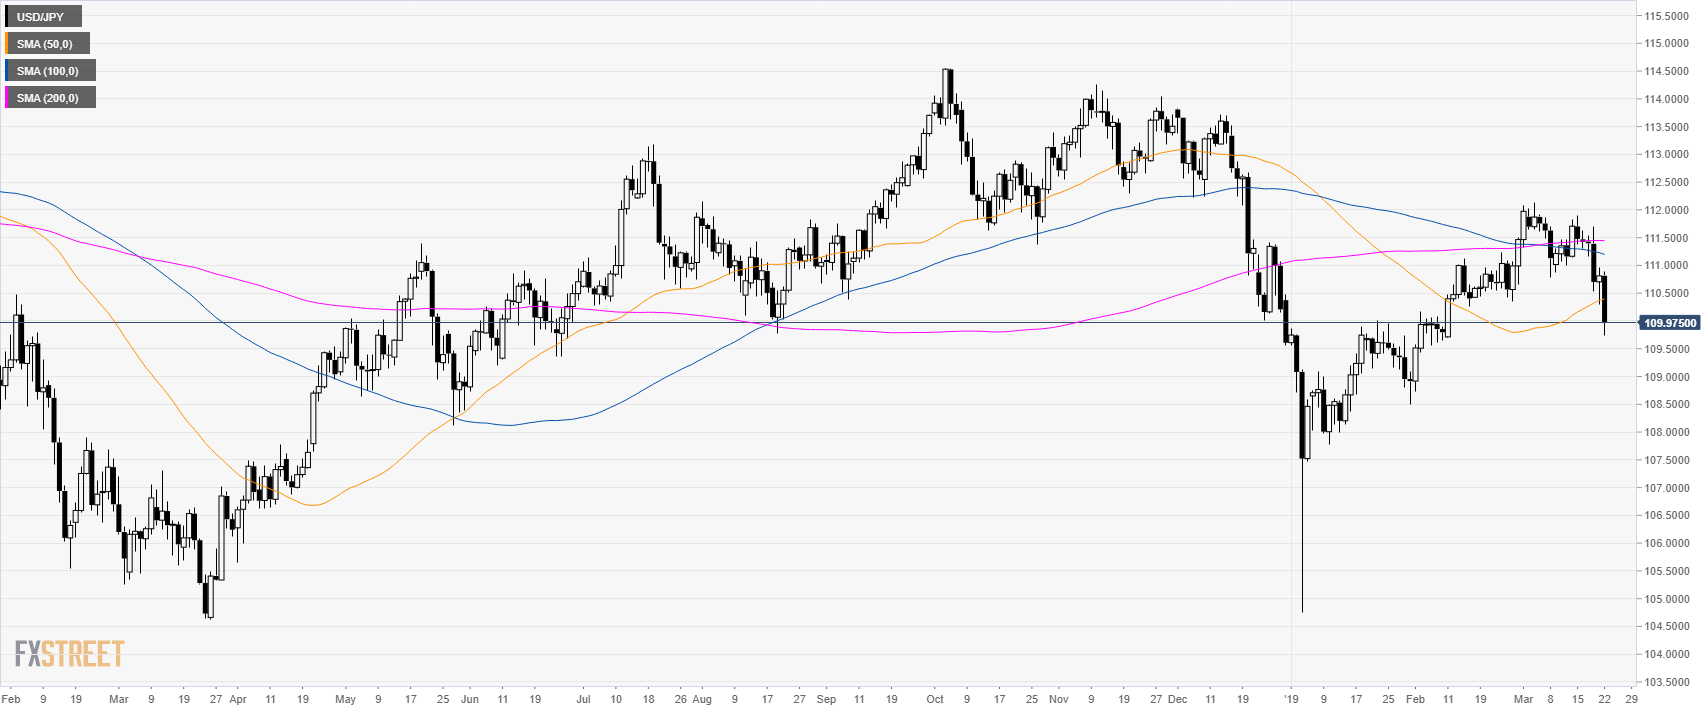
USD/JPY daily chart

  • USD/JPY is trading below its main simple moving averages (SMAs) suggesting bearish momentum.


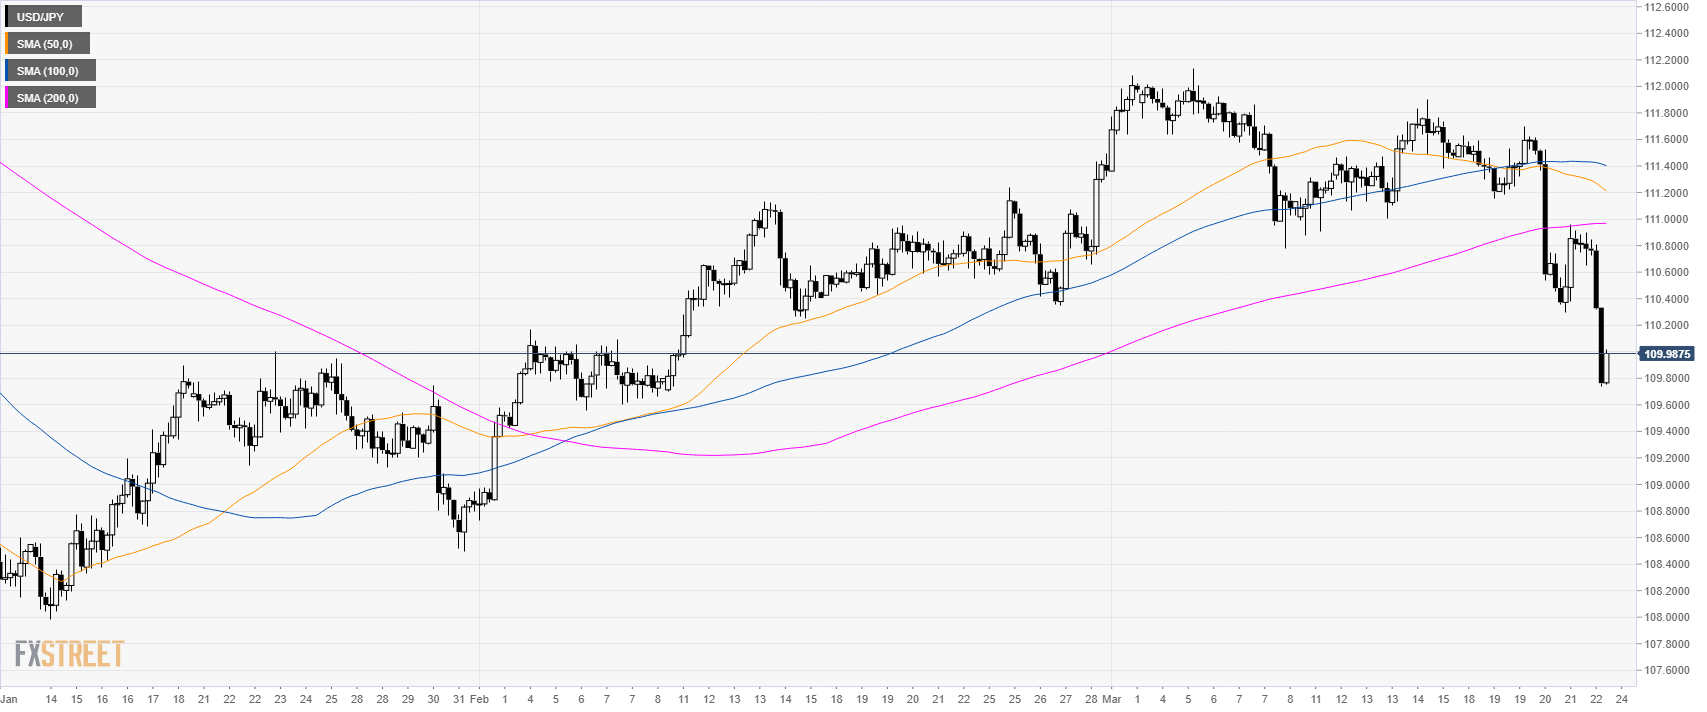
USD/JPY 4-hour chart

  • USD/JPY is trading below its main SMAs suggesting bearish momentum in the medium-term.


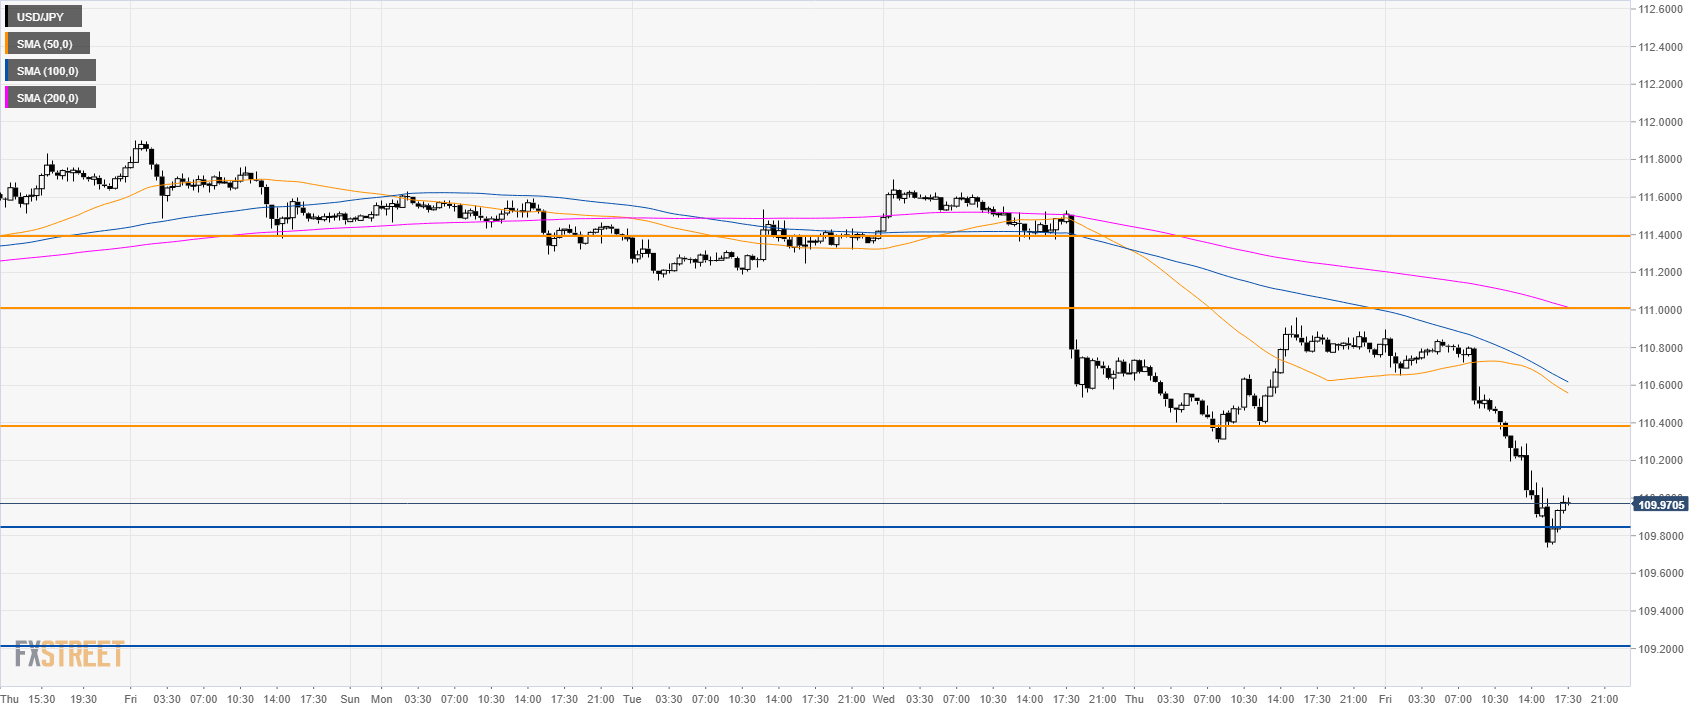
USD/JPY 30-minute chart

  • USD/JPY is trading below its main SMAs suggesting bearish momentum in the short-term.
  • A break below 110.80 can open the door to 109.20 support. 
  • To the upside, resistance is at 110.40 and 111.00 level.


Additional key levels

USD/JPY

Overview
Today last price109.98
Today Daily Change-0.83
Today Daily Change %-0.75
Today daily open110.81
 
Trends
Daily SMA20111.3
Daily SMA50110.37
Daily SMA100111.23
Daily SMA200111.45
 
Levels
Previous Daily High110.96
Previous Daily Low110.3
Previous Weekly High111.9
Previous Weekly Low110.88
Previous Monthly High111.5
Previous Monthly Low108.73
Daily Fibonacci 38.2%110.71
Daily Fibonacci 61.8%110.55
Daily Pivot Point S1110.42
Daily Pivot Point S2110.03
Daily Pivot Point S3109.76
Daily Pivot Point R1111.08
Daily Pivot Point R2111.35
Daily Pivot Point R3111.74

Author

Flavio Tosti

Flavio Tosti

Independent Analyst


More from Flavio Tosti
Share:

Editor's Picks

EUR/USD bounces off lows, back to 1.1860

EUR/USD now manages to regain some balance, retesting the 1.1860-1.1870 band after bottoming out near 1.1830 following the US NFP data on Wednesday. The pair, in the meantime, remains on the defensive amid fresh upside traction surrounding the US Dollar.

GBP/USD rebounds to 1.3660, USD loses momentum

GBP/USD trades with decent gains in the 1.3660 region, regaining composure following the post-NFP knee-jerk toward the 1.3600 zone on Wednesday. Cable, in the meantime, should now shift its attention to key UK data due on Thursday, including preliminary GDP gauges.

Gold stays bid, still below $5,100

Gold keeps the bid tone well in place on Wednesday, retargeting the $5,100 zone per troy ounce on the back of humble gains in the US Dollar and firm US Treasury yields across the curve. Moving forward, the yellow metal’s next test will come from the release of US CPI figures on Friday.

Ripple Price Forecast: XRP sell-side pressure intensifies despite surge in addresses transacting on-chain 

Ripple (XRP) is edging lower around $1.36 at the time of writing on Wednesday, weighed down by low retail interest and macroeconomic uncertainty, which is accelerating risk-off sentiment.

US jobs data surprises to the upside, boosts stocks but pushes back Fed rate cut expectations

This was an unusual payrolls report for two reasons. Firstly, because it was released on  Wednesday, and secondly, because it included the 2025 revisions alongside the January NFP figure.

XRP sell-off deepens amid weak retail interest, risk-off sentiment

Ripple (XRP) is edging lower around $1.36 at the time of writing on Wednesday, weighed down by low retail interest and macroeconomic uncertainty, which is accelerating risk-off sentiment.