|

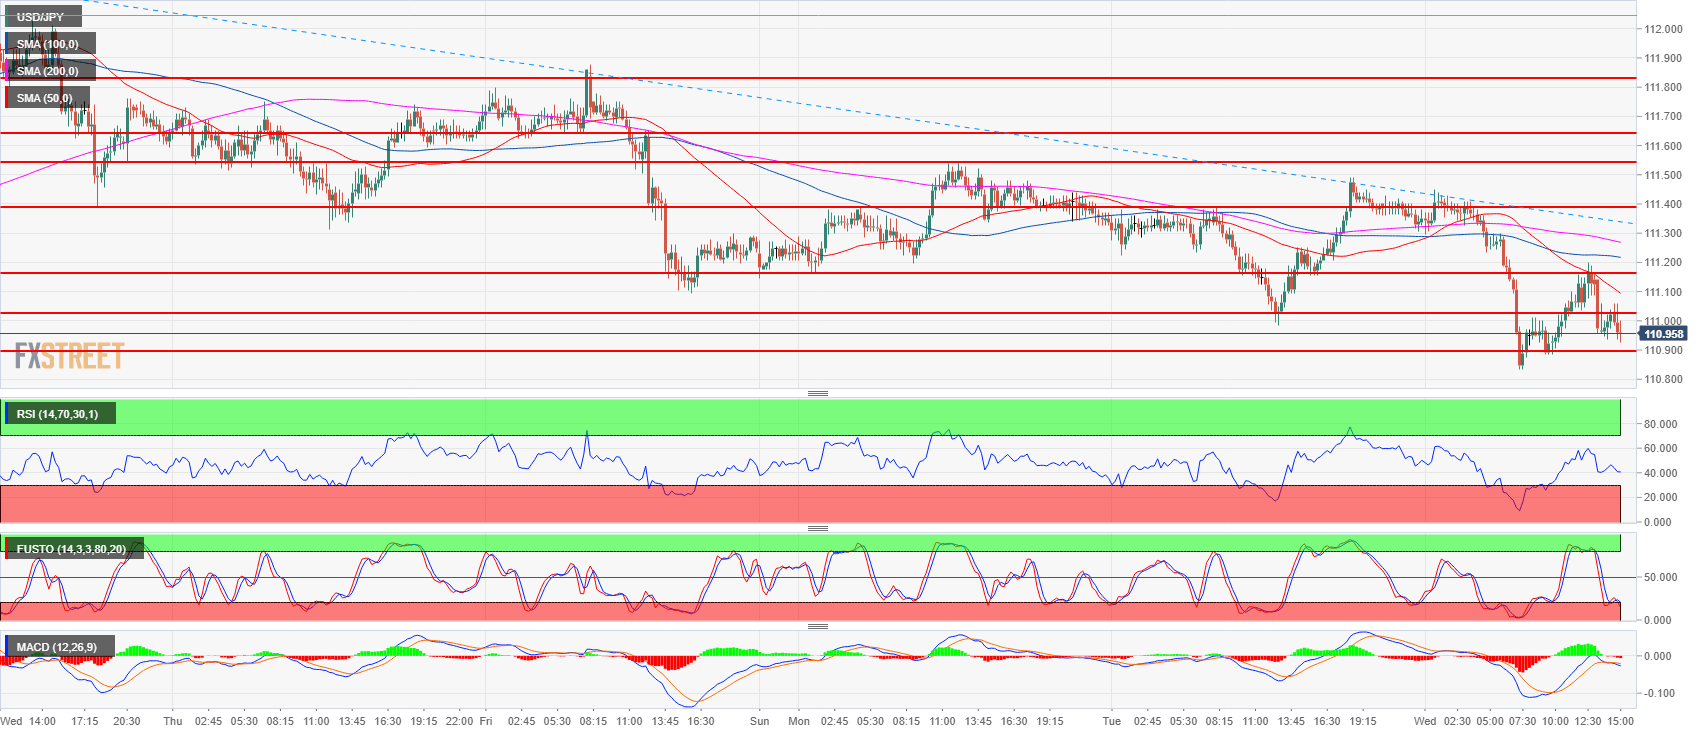
USD/JPY Technical Analysis: Bulls struggling near daily lows below 111.00 level

  • USD/JPY lost about 50 pips on Wednesday and fell below the 111.00 figure in early European trading. 
  • USD/JPY is trading below its 50, 100 and 200-period simple moving averages suggesting a short-term bearish bias. Bulls objective is to end the bearish pullback phase started on July 19 in order to resume the bullish trend. Ideally, they should be starting making higher highs and would need at least a breakout above 111.54-111.64 area with follow-through buying. 
  • On the flip side, bears want to convert the current bearish pullback into a bearish reversal. A breakout below 110.58 (July 26 swing low) might force bulls out of their positions and might lead to an acceleration towards 110.27 July 4 low, creating a lower low on the daily chart in the process. 
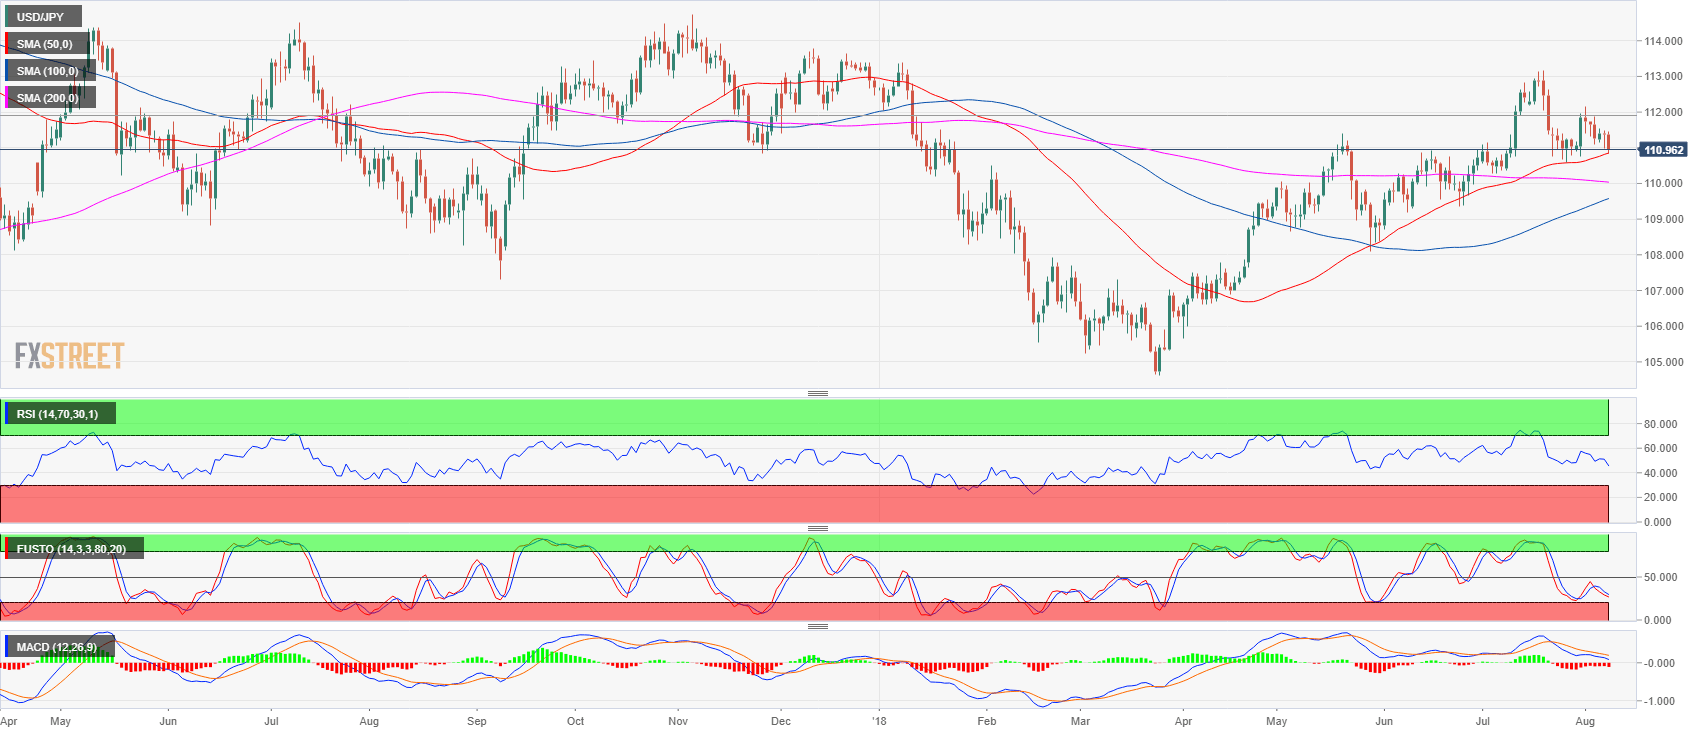
USD/JPY 15-minute chart


USD/JPY daily chart

Spot rate:                 110.97
Relative change:      -0.38%     
High:                        111.45
Low:                         110.83

Trend:                       Bullish / Bearish correction above 110.58 July 26 swing low

Resistance 1:  111.02-111.16 area, figure and current August 6 low
Resistance 2:  111.39 May 21 swing high
Resistance 3:  111.54-111.64 area, August 6, high and supply/demand level
Resistance 4:  111.82-112.00 area, supply level and figure
Resistance 5:  112.19-112.40 area, July 11 high and intraday swing low 
Resistance 6:  112.64 July 12 high
Resistance 7:  113.18, 2018 high
Resistance 8:  113.26-113.38, 200-weekly simple moving average and January 8 high
Resistance 9:  114.45 October 27, 2017 high 


Support 1:    110.90 June 15 swing high
Support 2:    110.75, July 23 low
Support 3:    110.58 July 26 swing low
Support 4:    110.27 July 4 low

Author

Flavio Tosti

Flavio Tosti

Independent Analyst


More from Flavio Tosti
Share:

Editor's Picks

EUR/USD holds above 1.1750 after mixed EU PMI data

EUR/USD manages to hold above 1.1750 but struggles to gather recovery momentum on Friday, following the mixed February PMI figures from Germany and the Eurozone. In the second half of the day, Q4 GDP, December inflation and February PMI data from the US will be watched closely by market participants.

GBP/USD recovers further toward 1.3500 after UK PMI data

GBP/USD is recovering ground further toward 1.3500 in European trading on Friday, helped by a modest uptick in the Pound Sterling after stronger-than-expected UK January Retail Sales and February PMI data. However, the pair's further upside could be limited amid persistent US Dollar strength as the focus turns to key US data. 

Gold sticks to positive bias above $5,000 ahead of US data

Gold gains some positive traction for the third consecutive day on Friday. holding above $5,000. Traders now look forward to the key US macro releases – the Advance Q4 GDP report and the Personal Consumption Expenditures (PCE) Price Index – for fresh trading impetus. 

US GDP growth expected to slow down significantly in Q4 after stellar Q3 

The United States Bureau of Economic Analysis will publish the first preliminary estimate of the fourth-quarter Gross Domestic Product at 13:30 GMT. Analysts forecast the US economy to have expanded at a 3% annualized rate, slowing down from the 4.4% growth posted in the previous quarter.

Iran tensions and AI fears at the forefront ahead of key US data

Thursday’s scorecard shows major US Stock benchmarks closed modestly in the red amid mounting US-Iran tensions and AI disruption worries. The S&P 500 shed 19 points (0.3%) to 6,861, the Nasdaq 100 lost 101 points (0.4%) to 24,797, and the Dow Jones Industrial Average dropped 267 points (0.5%) to 49,395.

Official Trump price approaches breakout with mixed signals from traders

Official Trump (TRUMP) is trading at $3.50 at the time of writing, approaching its upper consolidation range. A breakout from this range could open the door for an upside move. On-chain data shows market indecision, with balanced flows between bulls and bears, signaling a lack of clear directional bias.