|
USD/JPY Technical Analysis: bullish formation on 4H chart can recall 111.45

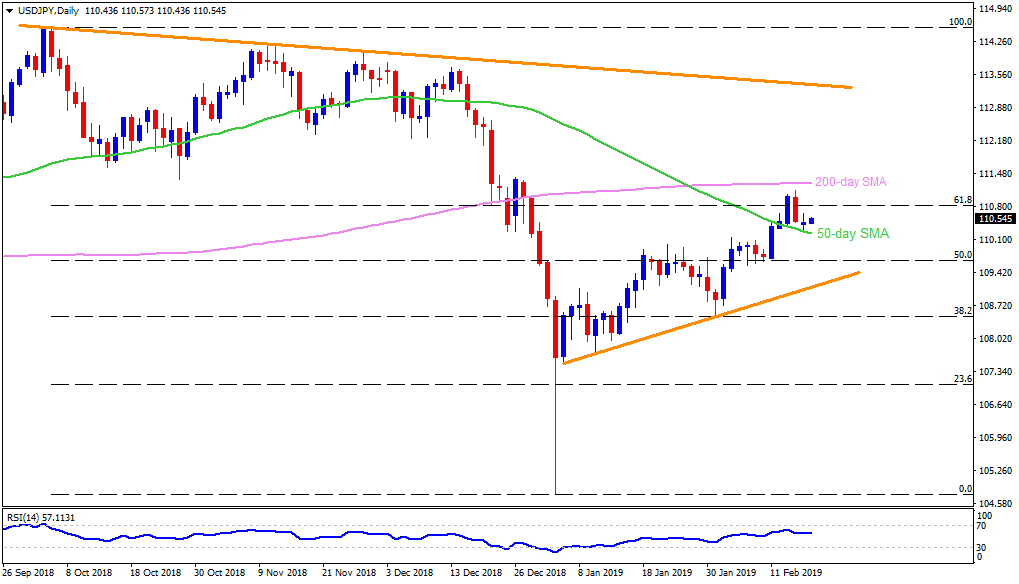
USD/JPY daily chart
- USD/JPY remain near to 110.50 during early Monday.
- The pair took a U-turn from 111.12 on Thursday but refrained to slid under 50-day simple moving average (SMA) of 110.23 on Friday.
- Sustained trading beyond 50-day SMA signals brighter chances of its up-moves to 200-day SMA level of 111.30 once it clears 111.12 resistance.
- Given the pair’s ability to trade successfully beyond 111.30, late-December high around 111.45 and 111.80 may entertain buyers.
- On a downside closing beneath 110.23, 110.00 and 109.80 can come back on the chart.
- Additionally, 50% Fibonacci retracement of its October – January slump, at 109.65, followed by six weeks long upward sloping trend-line, at 109.00, may limit the pair’s downturn past-109.65.
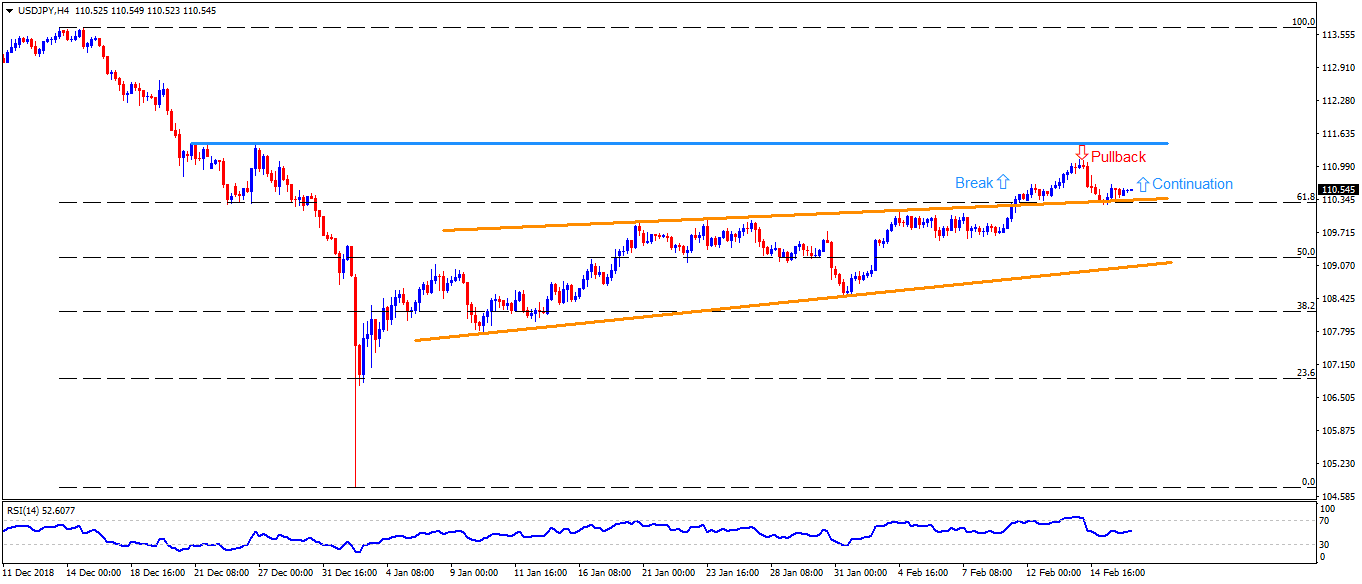
USD/JPY 4-Hour chart
- Considering the pair’s bounce off the trend-line connecting late-January highs to the early-month tops, short-term breakout-pullback-continuation (BPC) formation seems underway on the 4Hr chart.
- The pattern supports extended recovery to a last-week high of 111.15 prior to confronting 111.45 horizontal-resistance, a break of which can escalate the upward trajectory to 112.15.
- Alternatively, pair’s dip under 110.28, near to 61.8% Fibonacci retracement of mid-December to January declines, denies the upside signaling pattern and may recall 110.00 as a quote.
- During the pair’s declines below 110.00, 109.80 and 109.60 can entertain the sellers.
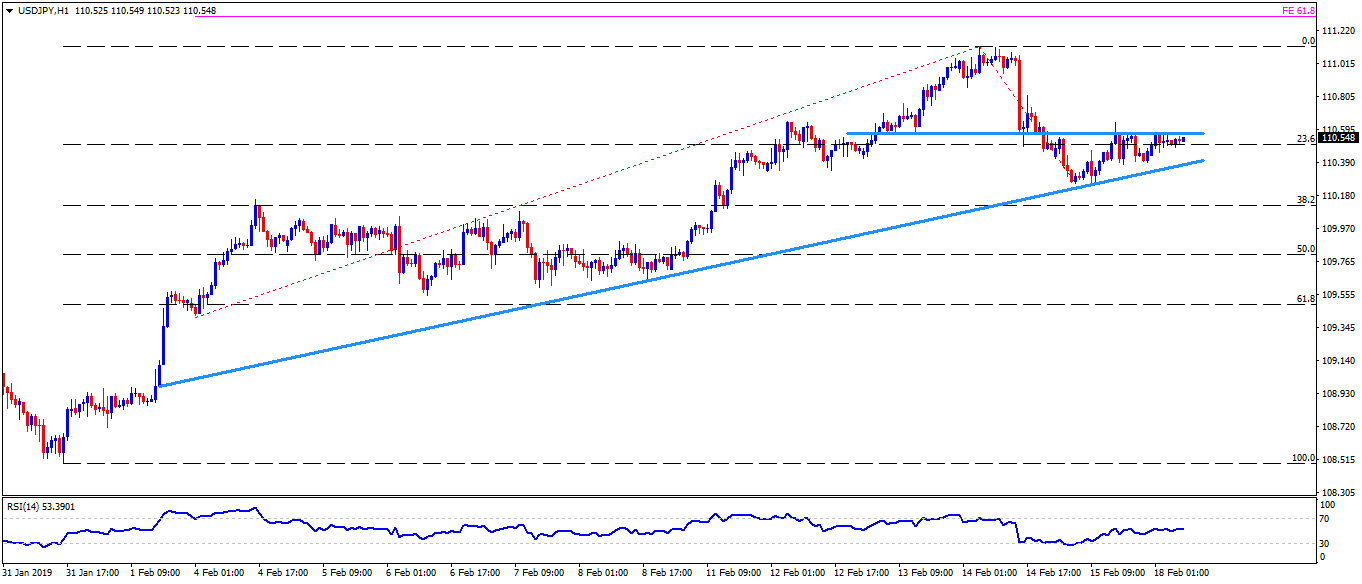
USD/JPY hourly chart
- A horizontal-line around 110.60 continues to act as immediate upside barrier for the pair’s rise toward 110.90 whereas 111.00, 111.15 and 61.8% Fibonacci expansion of its recent trade pattern, at 111.30, could play their role of resistance afterward.
- Meanwhile, an ascending trend-line connecting month’s lows since February 01, at 110.35, can limit the pair’s adjacent declines, a break of which might not hesitate to recall 110.25 and 110.10 on the chart.
Author

Anil Panchal
FXStreet
Anil Panchal has nearly 15 years of experience in tracking financial markets. With a keen interest in macroeconomics, Anil aptly tracks global news/updates and stays well-informed about the global financial moves and their implications.
More from Anil Panchal


