|

USD/JPY Price Forecast: Testing key lows, long-term uptrend at risk

  • USD/JPY has fallen to a key low – if it breaks and closes below it could threaten the uptrend. 
  • Such a move would probably turn the odds more in favor of bears. 

USD/JPY is testing support at key lows from where it bottomed and pulled back during August. If price breaks back below these lows it could risk signaling a reversal of the long-term uptrend, and suggest a major bearish shift in the technical outlook for the pair. 

USD/JPY Daily Chart 
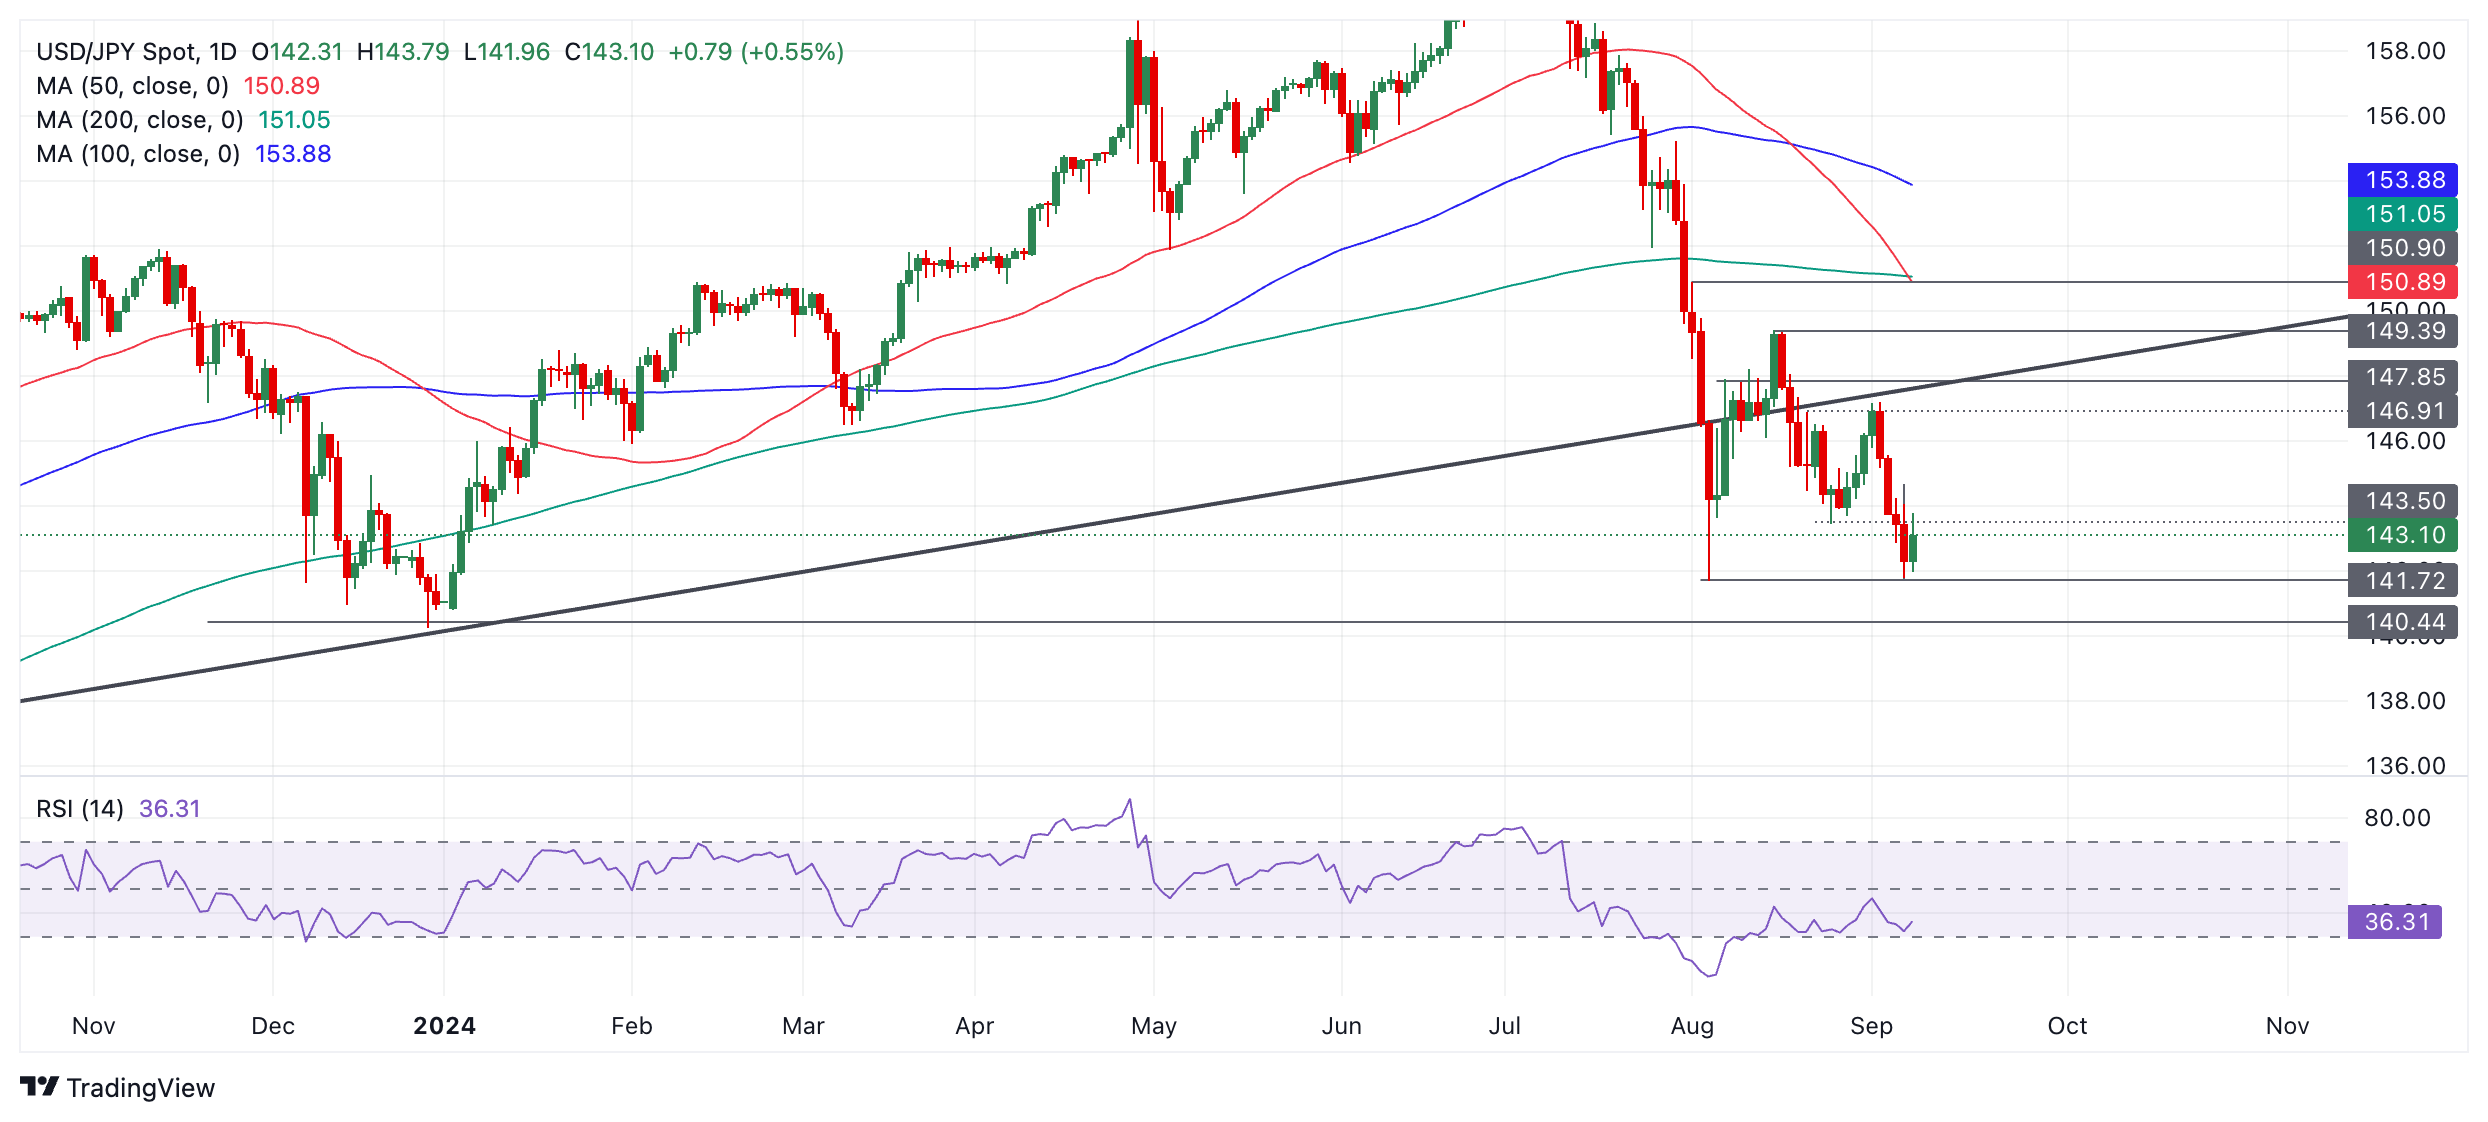


The pair has already broken below a major multi-year trendline, suggesting the long-term uptrend has been undermined. However, to confirm a reversal, price would have to break and close (on a daily or preferably weekly basis) below the August 5 low at 141.69. 

Strong support comes in at 140.25 (December 2023 low) and this could slow the pair’s descent. A break below that level too, would provide even more confirmatory evidence of a reversal in the trend. 

Given it is a principle of technical analysis theory that “the trend is your friend” , establishing the direction of the trend helps forecast where price is most likely to go next, so such a breakdown would increase the odds of more downside evolving in the future.

Author

Joaquin Monfort

Joaquin Monfort is a financial writer and analyst with over 10 years experience writing about financial markets and alt data. He holds a degree in Anthropology from London University and a Diploma in Technical analysis.


More from Joaquin Monfort
Share:

Editor's Picks

GBP/USD clings to gains; US CPI in focus

The British Pound holds onto two-day gains marginally at around 1.3500 against the US Dollar during the Asian trading session. The GBP/USD pair remains firm as the British Pound outperforms despite financial markets pricing out the possibility of an interest rate hike by the Bank of England in the near term.

EUR/USD flat lines near mid-1.1500s as traders await US CPI amid Iran uncertainty

The EUR/USD pair struggles to gain any meaningful traction, and holds steady around the 1.1545-1.1550 area during the Asian session. Traders seem hesitant to place aggressive bets and opt to wait for further developments surrounding the Middle East crisis and this week's release of the latest US inflation figures.

Gold surges past $4,400, hitting fresh two-month highs

Gold climbs further beyond $4,400, touching its highest level since June 5 in the Asian session on Tuesday. Easing Fed rate hike expectations continue to drive flows towards the non-yielding bullion. Meanwhile, inflation risks stemming from volatile oil prices back the case for at least one rate hike in 2026, which supports the US Dollar and might cap the precious metal ahead of the crucial US CPI report on Wednesday.

Bitcoin softens on institutional selling – CRV, ICP outperform
The broader cryptocurrency market shows mixed sentiment as Bitcoin (BTC) drops to $64,000 under institutional selling pressure. The Fear and Greed Index at 37, down from 40 the previous day, signals renewed bearish pressure. Meanwhile, Curve DAO (CRV) and Internet Computer (ICP) continue to extend their gains so far this week, emerging as top performers over the last 24 hours.
Dogecoin: Bullish divergence, whale accumulation support recovery hopes

Dogecoin shows early signs of a potential recovery, trading near $0.070 on Tuesday as bullish momentum divergence suggests selling pressure may be fading. In addition, whale accumulation and improving derivatives metrics suggest a bullish outlook, hinting at a potential recovery ahead.

9-3: Is the Federal Reserve’s vote tally Warsh's new forward guidance?
The rate did not move. Neither did the statement, and that’s the more interesting fact. Set the July 29 Federal Open Market Committee (FOMC) statement beside the one issued on June 17, and the two documents are identical apart from a single verb and a paragraph at the bottom naming three dissenters.