USD/JPY Price Forecast: Fluctuates around 151.00, tests key technical levels
- USD/JPY flirts with the 151.00 level, driven by rising US Treasury yields but held back by key resistance at the top of the Ichimoku Cloud.
- Momentum remains bullish, with the RSI hitting a new high, suggesting further upside towards the 200-DMA at 151.36 and beyond.
- A break below 151.00 could see support at 149.68, with further downside risks targeting the October low at 149.09.

The US Dollar prints back-to-back gains against the Japanese Yen on Tuesday but struggles to clear the 151.00 figure decisively. At the time of writing, the USD/JPY trades at 150.92, as the US 10-year T-note yield keeps the pair contained at around current exchange rates.
USD/JPY Price Forecast: Technical outlook
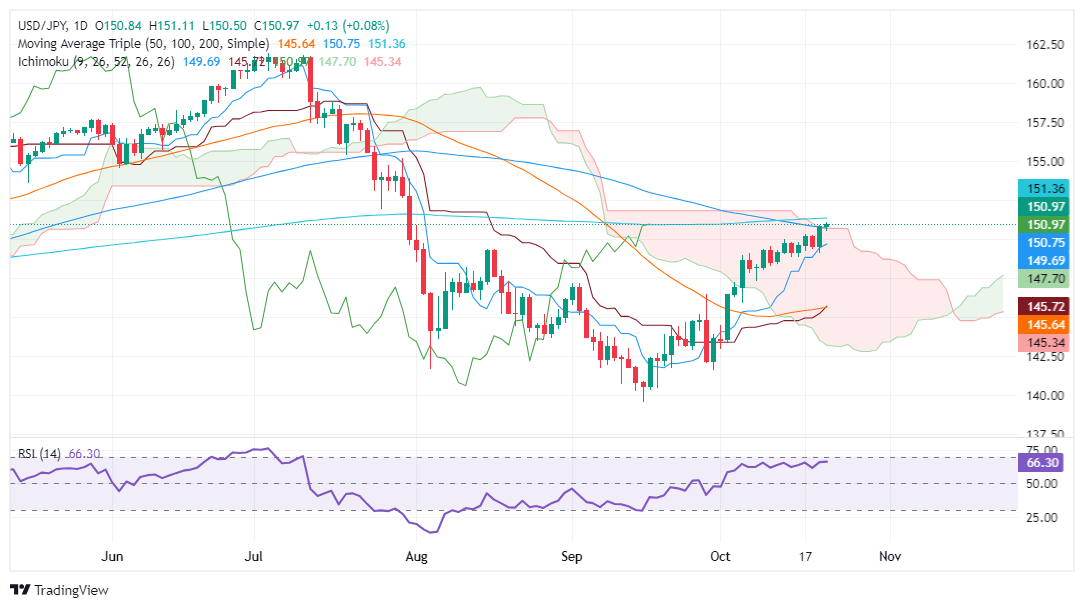
The USD/JPY is testing key resistance at the top of the Ichimoku Cloud (Kumo) at around 150.80/95, with buyers eyeing the 200-day moving average (DMA) at 151.36.
From a momentum standpoint, buyers are in charge. The Relative Strength Index (RSI) is reaching a new higher high, signaling bulls are gathering steam.
A daily close above the 151.00 figure could sponsor a test of the 200-DMA at 151.36. On further strength, the pair could test the July 25 swing low turned resistance at 151.93 before cracking 152.00.
Conversely, if USD/JPY dives beneath 151.00, the first key support would be the Tenkan-Sen at 149.68, ahead of the October 21 low of 149.09.
USD/JPY Price Chart – Daily
Japanese Yen PRICE Today
The table below shows the percentage change of Japanese Yen (JPY) against listed major currencies today. Japanese Yen was the strongest against the British Pound.
| USD | EUR | GBP | JPY | CAD | AUD | NZD | CHF | |
|---|---|---|---|---|---|---|---|---|
| USD | 0.02% | 0.04% | 0.09% | -0.05% | -0.37% | -0.26% | -0.14% | |
| EUR | -0.02% | 0.03% | 0.08% | -0.07% | -0.41% | -0.27% | -0.16% | |
| GBP | -0.04% | -0.03% | 0.04% | -0.08% | -0.43% | -0.31% | -0.19% | |
| JPY | -0.09% | -0.08% | -0.04% | -0.13% | -0.47% | -0.37% | -0.23% | |
| CAD | 0.05% | 0.07% | 0.08% | 0.13% | -0.32% | -0.22% | -0.10% | |
| AUD | 0.37% | 0.41% | 0.43% | 0.47% | 0.32% | 0.11% | 0.24% | |
| NZD | 0.26% | 0.27% | 0.31% | 0.37% | 0.22% | -0.11% | 0.13% | |
| CHF | 0.14% | 0.16% | 0.19% | 0.23% | 0.10% | -0.24% | -0.13% |
The heat map shows percentage changes of major currencies against each other. The base currency is picked from the left column, while the quote currency is picked from the top row. For example, if you pick the Japanese Yen from the left column and move along the horizontal line to the US Dollar, the percentage change displayed in the box will represent JPY (base)/USD (quote).
Author

Christian Borjon Valencia
FXStreet
Markets analyst, news editor, and trading instructor with over 14 years of experience across FX, commodities, US equity indices, and global macro markets.


