USD/JPY Price Forecast: Finds temporary support near 145.00
- USD/JPY gains temporary ground near 145.00 as the US Dollar recoups initial gains.
- The Japanese economy contracted by 0.2% in the first quarter of the year.
- Investors await the flash US Michigan survey data for May.

The USD/JPY pair recoups some of its initial losses and rebounds to near 145.50 during North American trading hours on Friday, while it is still 0.1% down. The pair recovers as the US Dollar bounces back and flattens, with investors awaiting the preliminary Michigan consumer sentiment and inflation expectations data for May, which will be published at 14:00 GMT.
The US Dollar Index (DXY), which gauges the Greenback’s value against six major currencies, turns flat around 100.80.
Investors will pay close attention to the US Consumer Sentiment Index data, which fell to 52.2 in April due to the trade war with China. This was the lowest figure seen since July 2022.
Meanwhile, the Japanese Yen (JPY) outperforms its peers despite weak Q1 Gross Domestic Product (GDP) data. The Japanese economy contracted by 0.2% in the January-March period, while it was expected to decline by 0.1%. In the last quarter of 2024, the economy expanded at a robust pace of 0.6%.
Japanese Yen PRICE Today
The table below shows the percentage change of Japanese Yen (JPY) against listed major currencies today. Japanese Yen was the strongest against the Swiss Franc.
| USD | EUR | GBP | JPY | CAD | AUD | NZD | CHF | |
|---|---|---|---|---|---|---|---|---|
| USD | -0.07% | 0.14% | -0.12% | -0.00% | -0.10% | -0.31% | 0.25% | |
| EUR | 0.07% | 0.21% | -0.03% | 0.05% | -0.02% | -0.24% | 0.31% | |
| GBP | -0.14% | -0.21% | -0.25% | -0.15% | -0.24% | -0.44% | 0.11% | |
| JPY | 0.12% | 0.03% | 0.25% | 0.10% | -0.02% | -0.23% | 0.34% | |
| CAD | 0.00% | -0.05% | 0.15% | -0.10% | -0.12% | -0.29% | 0.25% | |
| AUD | 0.10% | 0.02% | 0.24% | 0.02% | 0.12% | -0.20% | 0.35% | |
| NZD | 0.31% | 0.24% | 0.44% | 0.23% | 0.29% | 0.20% | 0.55% | |
| CHF | -0.25% | -0.31% | -0.11% | -0.34% | -0.25% | -0.35% | -0.55% |
The heat map shows percentage changes of major currencies against each other. The base currency is picked from the left column, while the quote currency is picked from the top row. For example, if you pick the Japanese Yen from the left column and move along the horizontal line to the US Dollar, the percentage change displayed in the box will represent JPY (base)/USD (quote).
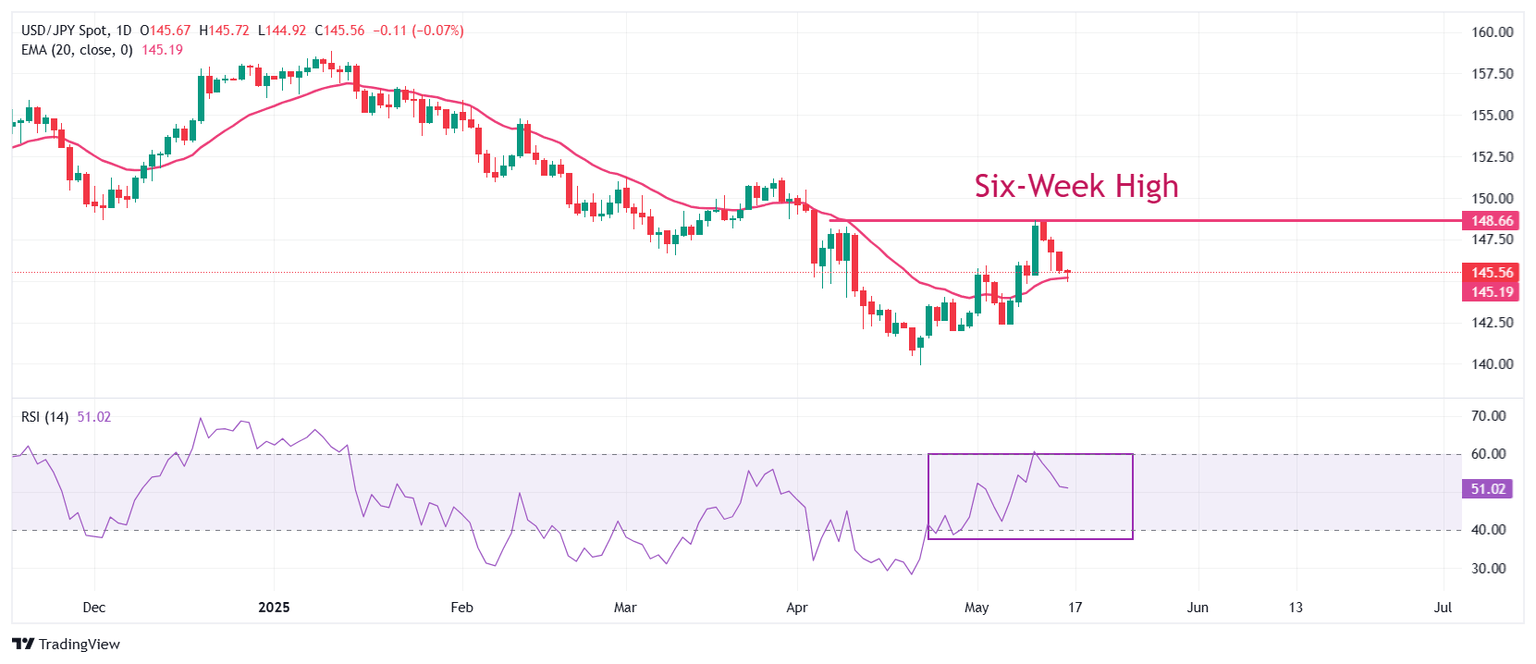
USD/JPY retraces significantly from an almost six-week high of 148.54 to near 145.00 on Friday. The 20-day Exponential Moving Average (EMA) near 145.20 continues to provide support to the pair.
The 14-day Relative Strength Index (RSI) struggles to break above 60.00. A fresh bullish momentum would trigger if the RSI breaks above the 60.00 level.
An upside move in the pair towards the psychological level of 150.00 and the March 28 high of 151.21 would come if it breaks above the May 13 high of 148.57.
The asset would face more downside towards the April 22 low of 139.90 and the 14 July 2023 low of 137.25 if it breaks below the May 7 low of 142.42.
USD/JPY daily chart
(This story was corrected at 13:45 GMT to say in the technical part that the 14-day Relative Strength Index (RSI) struggles to break above 60.00. A fresh bullish momentum would trigger if the RSI "breaks above" the 60.00 level and, not the RSI falls below the 60.00 level)
US Dollar FAQs
The US Dollar (USD) is the official currency of the United States of America, and the ‘de facto’ currency of a significant number of other countries where it is found in circulation alongside local notes. It is the most heavily traded currency in the world, accounting for over 88% of all global foreign exchange turnover, or an average of $6.6 trillion in transactions per day, according to data from 2022. Following the second world war, the USD took over from the British Pound as the world’s reserve currency. For most of its history, the US Dollar was backed by Gold, until the Bretton Woods Agreement in 1971 when the Gold Standard went away.
The most important single factor impacting on the value of the US Dollar is monetary policy, which is shaped by the Federal Reserve (Fed). The Fed has two mandates: to achieve price stability (control inflation) and foster full employment. Its primary tool to achieve these two goals is by adjusting interest rates. When prices are rising too quickly and inflation is above the Fed’s 2% target, the Fed will raise rates, which helps the USD value. When inflation falls below 2% or the Unemployment Rate is too high, the Fed may lower interest rates, which weighs on the Greenback.
In extreme situations, the Federal Reserve can also print more Dollars and enact quantitative easing (QE). QE is the process by which the Fed substantially increases the flow of credit in a stuck financial system. It is a non-standard policy measure used when credit has dried up because banks will not lend to each other (out of the fear of counterparty default). It is a last resort when simply lowering interest rates is unlikely to achieve the necessary result. It was the Fed’s weapon of choice to combat the credit crunch that occurred during the Great Financial Crisis in 2008. It involves the Fed printing more Dollars and using them to buy US government bonds predominantly from financial institutions. QE usually leads to a weaker US Dollar.
Quantitative tightening (QT) is the reverse process whereby the Federal Reserve stops buying bonds from financial institutions and does not reinvest the principal from the bonds it holds maturing in new purchases. It is usually positive for the US Dollar.
Author

Sagar Dua
FXStreet
Sagar Dua is associated with the financial markets from his college days. Along with pursuing post-graduation in Commerce in 2014, he started his markets training with chart analysis.


