USD/JPY Price Forecast: Falls below 144.00 as safe haven flows favor Yen
- Yen strengthens as investors seek safety amid unconfirmed trade deal rumors between US and China.
- USD/JPY finds support at 20-day SMA; daily close above 144.00 needed to regain bullish traction.
- Break below 143.00 could expose 141.97 and the YTD low at 139.88.

The USD/JPY dropped late during the North American session as investors seeking safety bought the Japanese Yen (JPY) and ditched the US Dollar (USD) amid the lack of announcements of trade deals, despite rumors that the US and China are close to beginning talks. At the time of writing, the USD/JPY trades at 143.80, down 0.80%.
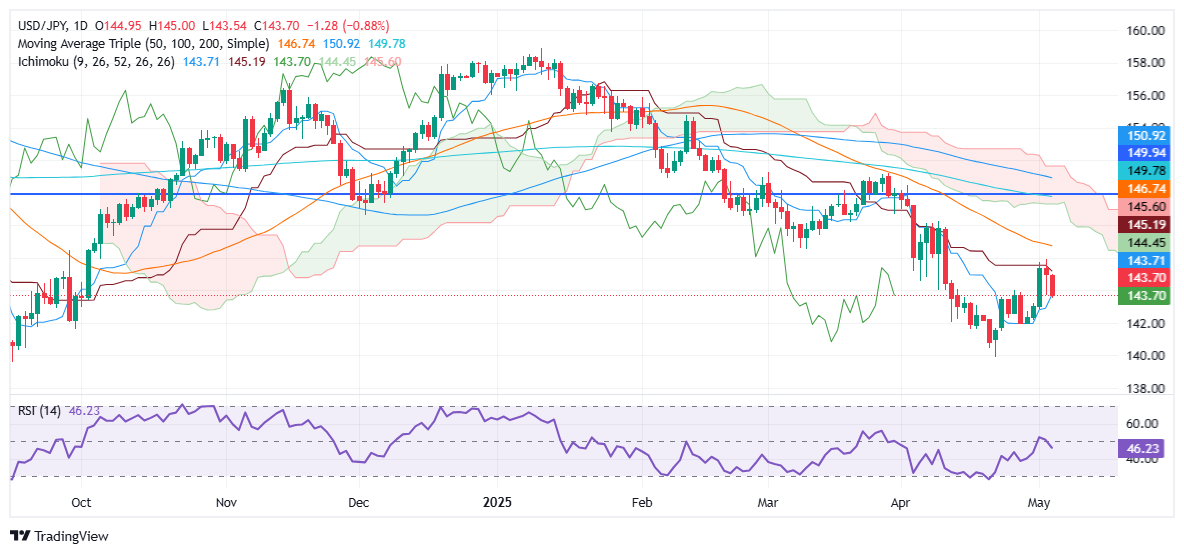
USD/JPY Price Forecast: Technical outlook
From a technical standpoint, the USD/JPY remains biased downward, hitting a lower low for the second consecutive trading day. Yet it found support at the 20-day Simple Moving Average (SMA) of 143.43 before buyers lifted the pair above the Kijun-seen at 143.70.
Although this could pave the way for a recovery, bulls need a daily close above 144.00 if they would like to test higher prices. Otherwise, if sellers push USD/JPY below 143.00, this clears the path to test the April 29 swing low of 141.97. If surpassed, the next stop would be the year-to-date (YTD) low of 139.88.
USD/JPY Price Chart – Daily
Japanese Yen PRICE Today
The table below shows the percentage change of Japanese Yen (JPY) against listed major currencies today. Japanese Yen was the strongest against the Canadian Dollar.
| USD | EUR | GBP | JPY | CAD | AUD | NZD | CHF | |
|---|---|---|---|---|---|---|---|---|
| USD | 0.14% | -0.24% | -0.63% | 0.08% | -0.21% | -0.29% | -0.38% | |
| EUR | -0.14% | -0.11% | -0.52% | 0.21% | -0.08% | -0.16% | -0.26% | |
| GBP | 0.24% | 0.11% | -0.63% | 0.32% | 0.02% | -0.06% | -0.15% | |
| JPY | 0.63% | 0.52% | 0.63% | 0.73% | 0.44% | 0.44% | 0.36% | |
| CAD | -0.08% | -0.21% | -0.32% | -0.73% | -0.59% | -0.38% | -0.47% | |
| AUD | 0.21% | 0.08% | -0.02% | -0.44% | 0.59% | -0.08% | -0.17% | |
| NZD | 0.29% | 0.16% | 0.06% | -0.44% | 0.38% | 0.08% | -0.10% | |
| CHF | 0.38% | 0.26% | 0.15% | -0.36% | 0.47% | 0.17% | 0.10% |
The heat map shows percentage changes of major currencies against each other. The base currency is picked from the left column, while the quote currency is picked from the top row. For example, if you pick the Japanese Yen from the left column and move along the horizontal line to the US Dollar, the percentage change displayed in the box will represent JPY (base)/USD (quote).
Author

Christian Borjon Valencia
FXStreet
Markets analyst, news editor, and trading instructor with over 14 years of experience across FX, commodities, US equity indices, and global macro markets.

















