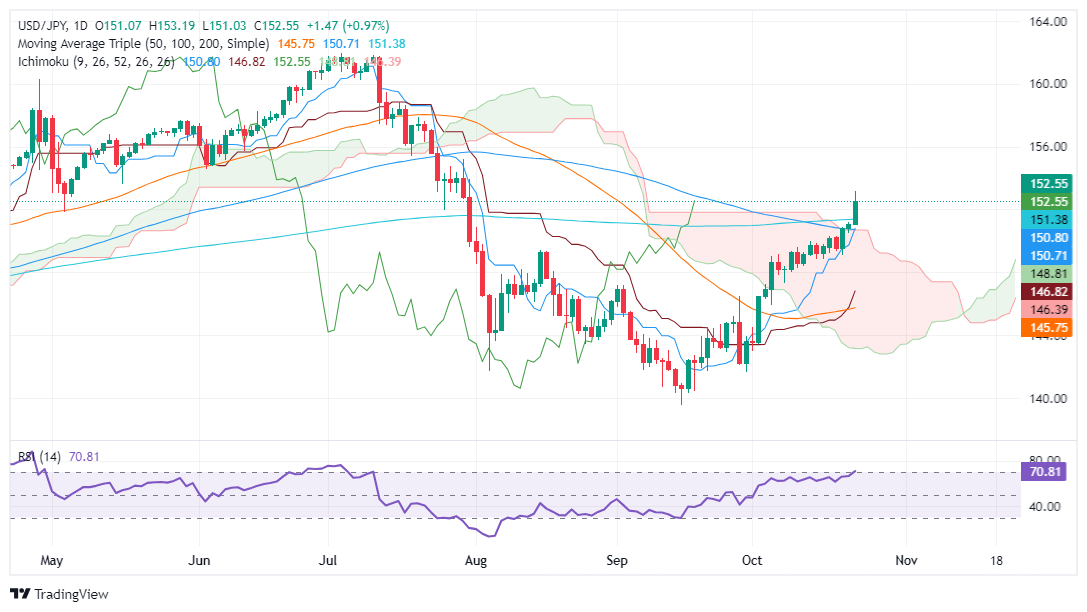
USD/JPY Price Forecast: Clears key-technical levels, turns bullish above 152.00
- USD/JPY turns bullish after clearing the Ichimoku Cloud and 200-day SMA, with momentum suggesting further upside towards the 160.00 target.
- Key resistance levels include the October 23 high of 153.19, followed by 154.00 and the July 30 peak at 155.21.
- A bearish scenario would require a break below the 200-day SMA at 151.38, with further support at 150.79 inside the Kumo.

The USD/JPY extended its gains sharply during Wednesday in the North American session, sponsored by the close positive correlation with the US 10-year T-note yield, while traders remain concerned about US elections. At the time of writing, the pair exchanges hands at 152.60, up by more than 1%.
USD/JPY Price Forecast: Technical outlook
The USD/JPY rose above the Ichimoku Cloud (Kumo) and the 200-day Simple Moving Average (SMA), turning bullish for the first time since early August 2024.
Momentum clearly indicates that buyers are in charge, and targeting the 160.00 figure, once they cleared key technical levels. In addition, the Relative Strength Index (RSI) cleared the latest peak, meaning that further USD/JPY upside is seen.
The USD/JPY first resistance would be the 153.19 October 23 daily high, followed by the 154.00 mark. On further strength, the USD/JPY could challenge the July 30 peak at 155.21, before etending its gains to July 19 peak at 157.86.
For a bearish scenario, sellers must clear the 200-day SMA at 151.38, before pushing the exchange rate below the Tenkan-Sen at 150.79, and inside the Kumo at 150.70.
USD/JPY Price Chart – Daily
Japanese Yen PRICE Today
The table below shows the percentage change of Japanese Yen (JPY) against listed major currencies today. Japanese Yen was the strongest against the Australian Dollar.
| USD | EUR | GBP | JPY | CAD | AUD | NZD | CHF | |
|---|---|---|---|---|---|---|---|---|
| USD | 0.22% | 0.51% | 0.98% | 0.17% | 0.85% | 0.72% | 0.13% | |
| EUR | -0.22% | 0.30% | 0.74% | -0.04% | 0.65% | 0.51% | -0.08% | |
| GBP | -0.51% | -0.30% | 0.45% | -0.36% | 0.35% | 0.21% | -0.34% | |
| JPY | -0.98% | -0.74% | -0.45% | -0.80% | -0.12% | -0.19% | -0.79% | |
| CAD | -0.17% | 0.04% | 0.36% | 0.80% | 0.69% | 0.58% | 0.02% | |
| AUD | -0.85% | -0.65% | -0.35% | 0.12% | -0.69% | -0.11% | -0.69% | |
| NZD | -0.72% | -0.51% | -0.21% | 0.19% | -0.58% | 0.11% | -0.57% | |
| CHF | -0.13% | 0.08% | 0.34% | 0.79% | -0.02% | 0.69% | 0.57% |
The heat map shows percentage changes of major currencies against each other. The base currency is picked from the left column, while the quote currency is picked from the top row. For example, if you pick the Japanese Yen from the left column and move along the horizontal line to the US Dollar, the percentage change displayed in the box will represent JPY (base)/USD (quote).
Author

Christian Borjon Valencia
FXStreet
Markets analyst, news editor, and trading instructor with over 14 years of experience across FX, commodities, US equity indices, and global macro markets.


