|

USD/JPY Price Analysis: Stretches rebounds from 50-SMA past 136.00

  • USD/JPY grinds near intraday top after lackluster moves in the last two days.
  • Sustained trading beyond key SMA, short-term important horizontal support keeps buyers hopeful.
  • One-month-old ascending resistance line can challenge the latest run-up.

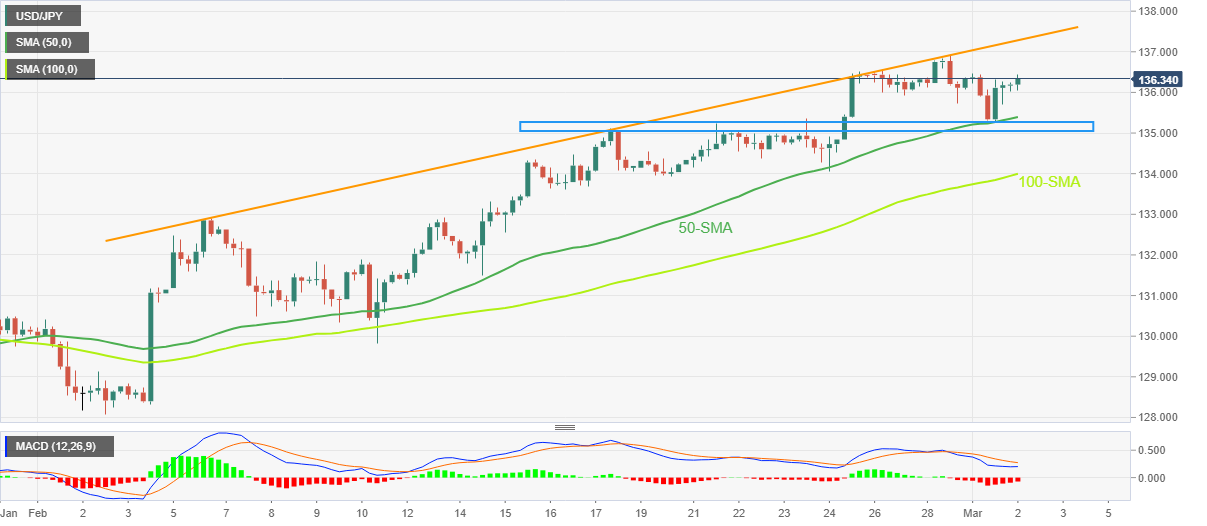
USD/JPY struggles to overcome the previous two-day inaction as bulls keep the reins around 136.30 during early Thursday. In doing so, the Yen pair prints mild gains after bouncing off the 50-bar Simple Moving Average (SMA) and a two-week-old horizontal support zone.

Not only a sustained recovery from the key technical levels but the easing bearish bias of the MACD signals also favor the USD/JPY pair buyers.

With this, the risk-barometer pair is well-set to poke an upward-sloping resistance line from early February, close to 137.30 by the press time,

It’s worth noting that the weekly top surrounding 136.90 and the 137.00 round figure could act as immediate resistances for the USD/JPY bulls to watch.

In a case where USD/JPY remains firmer past 137.30, the late 2022 peak surrounding 138.20 should return to the charts.

On the flip side, the 50-SMA level of near 135.40 acts as an adjacent support for the Yen pair. Following that, the aforementioned two-week-long horizontal support zone puts a floor under the USD/JPY price of around 135.05-25.

It should be noted that the 100-SMA level of 134.00 and the February 20 swing low of around 133.95 could act as the last defense of the USD/JPY buyers.

To sum up, USD/JPY is likely to remain firmer and can once again poke the key resistance line stretched from February.

USD/JPY: Four-hour chart

Trend: Limited upside expected

Additional impotant levels

Overview
Today last price136.38
Today Daily Change0.20
Today Daily Change %0.15%
Today daily open136.18
 
Trends
Daily SMA20133.47
Daily SMA50131.94
Daily SMA100136.86
Daily SMA200137.22
 
Levels
Previous Daily High136.47
Previous Daily Low135.26
Previous Weekly High136.52
Previous Weekly Low133.92
Previous Monthly High136.92
Previous Monthly Low128.08
Daily Fibonacci 38.2%136.01
Daily Fibonacci 61.8%135.72
Daily Pivot Point S1135.47
Daily Pivot Point S2134.76
Daily Pivot Point S3134.26
Daily Pivot Point R1136.68
Daily Pivot Point R2137.18
Daily Pivot Point R3137.89

Author

Anil Panchal

Anil Panchal

FXStreet

Anil Panchal has nearly 15 years of experience in tracking financial markets. With a keen interest in macroeconomics, Anil aptly tracks global news/updates and stays well-informed about the global financial moves and their implications.

More from Anil Panchal
Share:

Markets move fast. We move first.

Orange Juice Newsletter brings you expert driven insights - not headlines. Every day on your inbox.

By subscribing you agree to our Terms and conditions.

Editor's Picks

EUR/USD moves sideways below 1.1800 on Christmas Eve

EUR/USD struggles to find direction and trades in a narrow channel below 1.1800 after posting gains for two consecutive days. Bond and stock markets in the US will open at the usual time and close early on Christmas Eve, allowing the trading action to remain subdued. 

GBP/USD keeps range around 1.3500 amid quiet markets

GBP/USD keeps its range trade intact at around 1.3500 on Wednesday. The Pound Sterling holds the upper hand over the US Dollar amid pre-Christmas light trading as traders move to the sidelines heading into the holiday season. 

Gold retreats from record highs, trades below $4,500

Gold retreats after setting a new record-high above $4,520 earlier in the day and trades in a tight range below $4,500 as trading volumes thin out ahead of the Christmas break. The US Dollar selling bias remains unabated on the back of dovish Fed expectations, which continues to act as a tailwind for the bullion amid persistent geopolitical risks.

Bitcoin slips below $87,000 as ETF outflows intensify, whale participation declines

Bitcoin price continues to trade around $86,770 on Wednesday, after failing to break above the $90,000 resistance. US-listed spot ETFs record an outflow of $188.64 million on Tuesday, marking the fourth consecutive day of withdrawals.

Economic outlook 2026-2027 in advanced countries: Solidity test

After a year marked by global economic resilience and ending on a note of optimism, 2026 looks promising and could be a year of solid economic performance. In our baseline scenario, we expect most of the supportive factors at work in 2025 to continue to play a role in 2026.

Avalanche struggles near $12 as Grayscale files updated form for ETF

Avalanche trades close to $12 by press time on Wednesday, extending the nearly 2% drop from the previous day. Grayscale filed an updated form to convert its Avalanche-focused Trust into an ETF with the US Securities and Exchange Commission.