USD/JPY Price Analysis: Snaps three-day downtrend amid risk-on mood, bounces off 10-DMA
- USD/JPY takes bids to intraday high, rises for the first time in four days.
- Strong RSI conditions, short-term rising channel favor bulls.
- Monthly support line adds to the downside filters.

USD/JPY refreshes intraday high to 105.68 in the latest run-up during early Monday. The risk barometer seems to have tracked upbeat signals from S&P 500 Futures and the US 10-year Treasury yields.
In doing so, the quote defies the previous three-day declines, currently up 0.21% intraday, while extending the U-turn from 10-day SMA.
Considering the RSI line being slightly distanced from the overbought region, the latest run-up has room to the north. With this, the USD/JPY bulls eye 106.00 as an immediate resistance ahead of the monthly peak surrounding 106.25.
It should, however, be noted that an ascending trend line from February 05 and the upper line of a seven-week-old rising trend channel, respectively around 106.40 and 106.55, will challenge the further upside.
Meanwhile, a downside break of 10-day SMA, at 105.28 now, needs to break below the immediate support line from late-January as well as the stated channel’s lower line, near 105.00 and 104.75 in that order, to recall the USD/JPY sellers.
Overall, the upbeat market sentiment joins the pair’s U-turn from the short-term SMA to favor the USD/JPY buyers.
USD/JPY daily chart
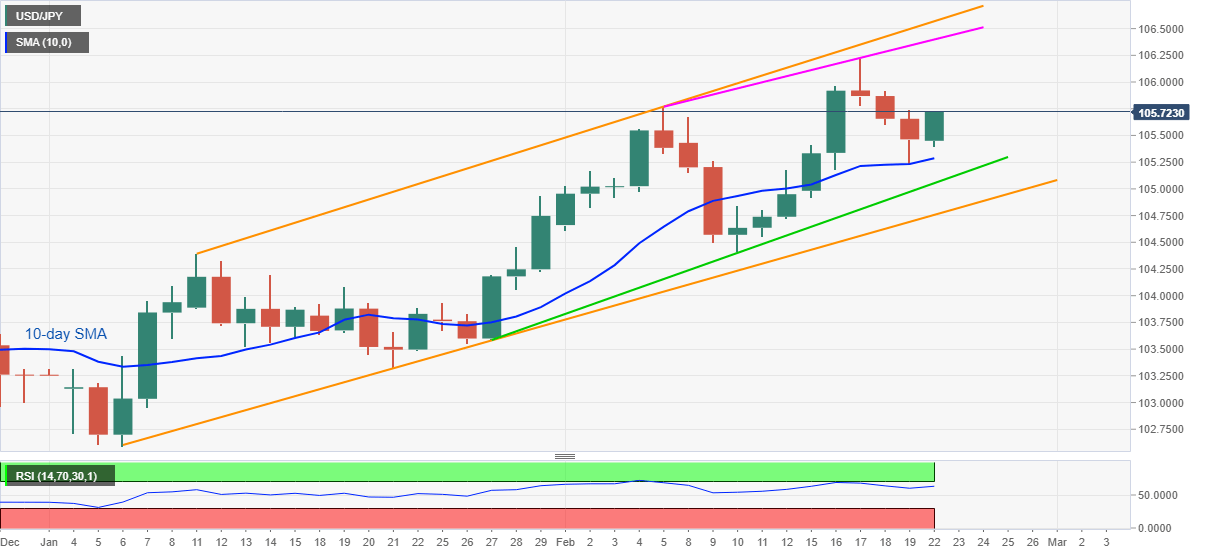
Trend: Bullish
Author

Anil Panchal
FXStreet
Anil Panchal has nearly 15 years of experience in tracking financial markets. With a keen interest in macroeconomics, Anil aptly tracks global news/updates and stays well-informed about the global financial moves and their implications.


