|

USD/JPY Price Analysis: Reverses south swiftly as investors assess BoJ policy

  • USD/JPY shed gains and reverses quickly after the BoJ policy announcement.
  • The US Dollar Index is juggling in a narrow range around 101.80 after a rally as the US economy turned surprisingly resilient than expected.
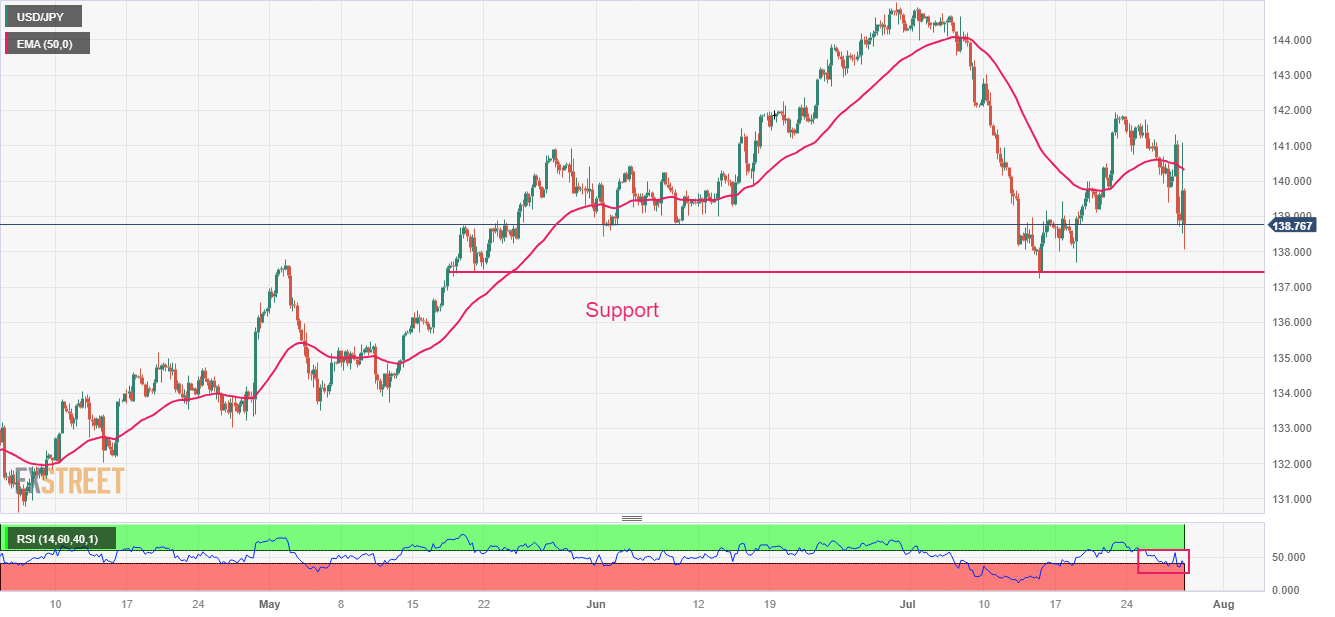
  • USD/JPY is declining towards the horizontal support which is plotted around 137.43.

The USD/JPY pair demonstrates wild spikes after the Bank of Japan (BoJ) allows more flexibility in Japanese Government Bonds (JGBs) yields but as usual, keeps interest rates unchanged. Changing dynamics in the Japanese economy as wages and corporate earnings have increased are allowing the central bank to gradually move towards tightening monetary policy so that the Japanese yen could be safeguarded against other currencies.

Before the policy announcement, Japanese Finance Minister Shunichi Suzuki hit the wires, citing that they are “closely watching fed and other central banks' policy decisions.” This indicates that expectations of an intervention to provide a cushion to the Japanese Yen are still open.

Meanwhile, the US Dollar Index (DXY) is juggling in a narrow range around 101.80 after a rally as the United Stated economy turned surprisingly resilient than expected.

USD/JPY is declining towards the horizontal support which is plotted from May 19 low around 137.43 on a four-hour scale. The asset has failed to sustain above the 50-period Exponential Moving Average (EMA) at 140.36, which indicates that the short-term trend is bearish.

A slippage below 40.00 by the Relative Strength Index (RSI) (14) would activate the bearish momentum.

Going forward, a decisive breakdown of May 19 low around 137.43 would expose the asset to May 16 low at 135.67 followed by May 11 low at 133.75.

In an alternate scenario, a decisive move above July 21 high at 142.00 would send the major toward July 10 high at 143.00. Breach of the latter would drive the asset towards June high at 145.07.

USD/JPY four-hour chart

USD/JPY

Overview
Today last price138.77
Today Daily Change-0.70
Today Daily Change %-0.50
Today daily open139.47
 
Trends
Daily SMA20141.13
Daily SMA50140.9
Daily SMA100137.35
Daily SMA200136.73
 
Levels
Previous Daily High141.32
Previous Daily Low138.76
Previous Weekly High141.96
Previous Weekly Low137.68
Previous Monthly High145.07
Previous Monthly Low138.43
Daily Fibonacci 38.2%139.74
Daily Fibonacci 61.8%140.35
Daily Pivot Point S1138.38
Daily Pivot Point S2137.29
Daily Pivot Point S3135.82
Daily Pivot Point R1140.94
Daily Pivot Point R2142.41
Daily Pivot Point R3143.5

Author

Sagar Dua

Sagar Dua

FXStreet

Sagar Dua is associated with the financial markets from his college days. Along with pursuing post-graduation in Commerce in 2014, he started his markets training with chart analysis.

More from Sagar Dua
Share:

Markets move fast. We move first.

Orange Juice Newsletter brings you expert driven insights - not headlines. Every day on your inbox.

By subscribing you agree to our Terms and conditions.

Editor's Picks

EUR/USD moves sideways below 1.1800 on Christmas Eve

EUR/USD struggles to find direction and trades in a narrow channel below 1.1800 after posting gains for two consecutive days. Bond and stock markets in the US will open at the usual time and close early on Christmas Eve, allowing the trading action to remain subdued. 

GBP/USD keeps range around 1.3500 amid quiet markets

GBP/USD keeps its range trade intact at around 1.3500 on Wednesday. The Pound Sterling holds the upper hand over the US Dollar amid pre-Christmas light trading as traders move to the sidelines heading into the holiday season. 

Gold retreats from record highs, trades below $4,500

Gold retreats after setting a new record-high above $4,520 earlier in the day and trades in a tight range below $4,500 as trading volumes thin out ahead of the Christmas break. The US Dollar selling bias remains unabated on the back of dovish Fed expectations, which continues to act as a tailwind for the bullion amid persistent geopolitical risks.

Bitcoin slips below $87,000 as ETF outflows intensify, whale participation declines

Bitcoin price continues to trade around $86,770 on Wednesday, after failing to break above the $90,000 resistance. US-listed spot ETFs record an outflow of $188.64 million on Tuesday, marking the fourth consecutive day of withdrawals.

Economic outlook 2026-2027 in advanced countries: Solidity test

After a year marked by global economic resilience and ending on a note of optimism, 2026 looks promising and could be a year of solid economic performance. In our baseline scenario, we expect most of the supportive factors at work in 2025 to continue to play a role in 2026.

Avalanche struggles near $12 as Grayscale files updated form for ETF

Avalanche trades close to $12 by press time on Wednesday, extending the nearly 2% drop from the previous day. Grayscale filed an updated form to convert its Avalanche-focused Trust into an ETF with the US Securities and Exchange Commission.