USD/JPY Price Analysis: Retests 116.00 on breaking weekly support but bulls stay hopeful


  • USD/JPY consolidates the heaviest daily gains in six weeks near five-year top.
  • Bullish flag, sustained trading above 50-HMA keeps buyers hopeful.
  • Bears may wait for downside break of November’s top, 116.20 acts as the key resistance.
  • Overbought RSI triggered pullback on D1, 114.00 is crucial support.

USD/JPY pulls back from five-year high to retest 116.00, down 0.06% intraday heading into Wednesday‘s European session.

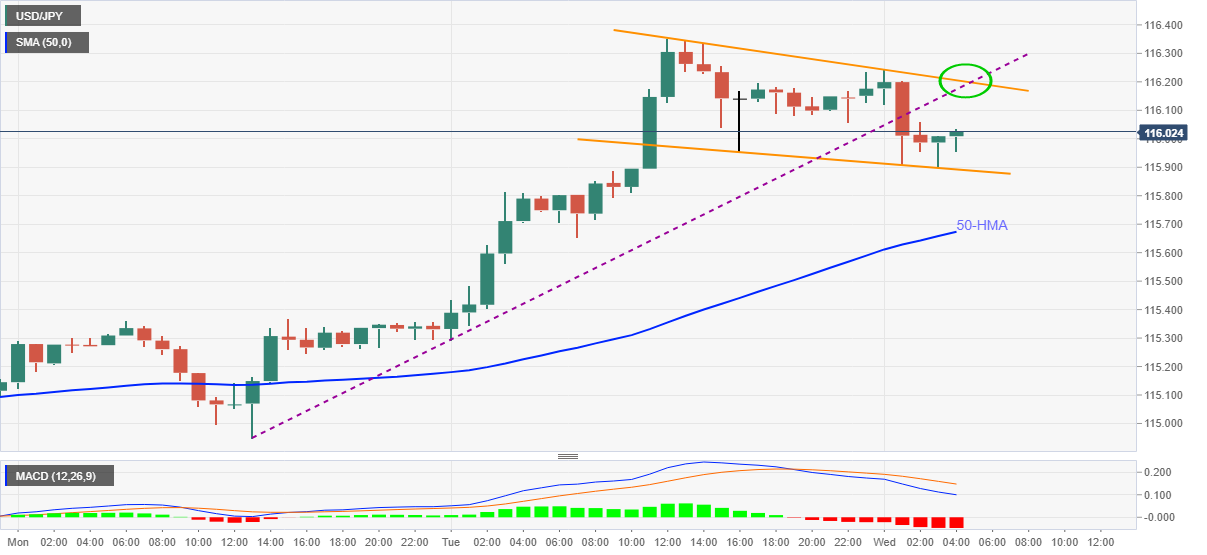
In doing so, the yen pair seesaws inside a short-term bull-flag chart pattern amid overbought RSI on the daily and bearish MACD signals on the hourly formations. That said, the quote’s latest weakness could be linked to a downside break of the weekly support line, now resistance.

It’s worth noting that the stated flag’s support line near 115.90 restricts the quote’s immediate downside ahead of the 50-HMA level of 115.67.

Meanwhile, a convergence of the previous support and flag’s upper line, near 116.20, appears a tough nut to crack for the USD/JPY bulls.

USD/JPY: Hourly chart

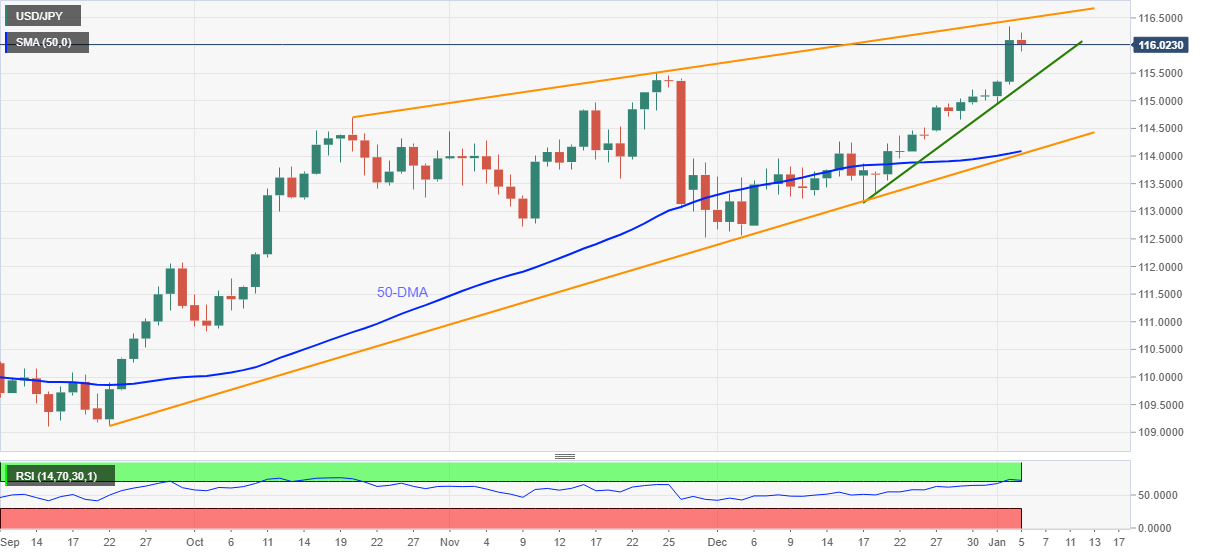
In contrast to the hourly chart, the daily play suggests that the USD/JPY bulls are running out of steam, per overbought RSI, around an upward sloping trend line from October around 116.50.

The pullback moves, however, remain less worrisome until breaking a two-week-old support line near 115.25.

Even so, the USD/JPY pair seller remains cautious until the quote stays beyond 50-DMA and an upward sloping trend line from September, close to 114.00.

To sum up, USD/JPY traders are seeking fresh clues around the multi-day top.

USD/JPY: Daily chart

Additional important levels

Overview
Today last price 115.99
Today Daily Change -0.11
Today Daily Change % -0.09%
Today daily open 116.1
 
Trends
Daily SMA20 114.31
Daily SMA50 114.05
Daily SMA100 112.59
Daily SMA200 111.14
 
Levels
Previous Daily High 116.35
Previous Daily Low 115.29
Previous Weekly High 115.21
Previous Weekly Low 114.45
Previous Monthly High 115.21
Previous Monthly Low 112.56
Daily Fibonacci 38.2% 115.95
Daily Fibonacci 61.8% 115.7
Daily Pivot Point S1 115.48
Daily Pivot Point S2 114.85
Daily Pivot Point S3 114.42
Daily Pivot Point R1 116.54
Daily Pivot Point R2 116.98
Daily Pivot Point R3 117.6


Share: Feed news

Information on these pages contains forward-looking statements that involve risks and uncertainties. Markets and instruments profiled on this page are for informational purposes only and should not in any way come across as a recommendation to buy or sell in these assets. You should do your own thorough research before making any investment decisions. FXStreet does not in any way guarantee that this information is free from mistakes, errors, or material misstatements. It also does not guarantee that this information is of a timely nature. Investing in Open Markets involves a great deal of risk, including the loss of all or a portion of your investment, as well as emotional distress. All risks, losses and costs associated with investing, including total loss of principal, are your responsibility. The views and opinions expressed in this article are those of the authors and do not necessarily reflect the official policy or position of FXStreet nor its advertisers. The author will not be held responsible for information that is found at the end of links posted on this page.

If not otherwise explicitly mentioned in the body of the article, at the time of writing, the author has no position in any stock mentioned in this article and no business relationship with any company mentioned. The author has not received compensation for writing this article, other than from FXStreet.

FXStreet and the author do not provide personalized recommendations. The author makes no representations as to the accuracy, completeness, or suitability of this information. FXStreet and the author will not be liable for any errors, omissions or any losses, injuries or damages arising from this information and its display or use. Errors and omissions excepted.

The author and FXStreet are not registered investment advisors and nothing in this article is intended to be investment advice.

Recommended content


Recommended content

Editors’ Picks

AUD/USD stands firm above 0.6500 with markets bracing for Aussie PPI, US inflation

AUD/USD stands firm above 0.6500 with markets bracing for Aussie PPI, US inflation

The Aussie Dollar begins Friday’s Asian session on the right foot against the Greenback after posting gains of 0.33% on Thursday. The AUD/USD advance was sponsored by a United States report showing the economy is growing below estimates while inflation picked up. The pair traded at 0.6518.

AUD/USD News

USD/JPY climbs relentlessly ahead of BoJ meeting

USD/JPY climbs relentlessly ahead of BoJ meeting

The USD/JPY extends its uptrend despite verbal intervention from the Minister of Finance. The wide differential between US and Japanese interest rates is seen as a major factor contributing to the rise. The idea that a lot is already priced into the US Dollar could limit USD/JPY upside.

USD/JPY News

Gold holds around $2,330 after dismal US data

Gold holds around $2,330 after dismal US data

Gold fell below $2,320 in the early American session as US yields shot higher after the data showed a significant increase in the US GDP price deflator in Q1. With safe-haven flows dominating the markets, however, XAU/USD reversed its direction and rose above $2,340.

Gold News

Bitcoin price continues to get rejected from $65K resistance as SEC delays decision on spot BTC ETF options

Bitcoin price continues to get rejected from $65K resistance as SEC delays decision on spot BTC ETF options

Bitcoin (BTC) price has markets in disarray, provoking a broader market crash as it slumped to the $62,000 range on Thursday. Meanwhile, reverberations from spot BTC exchange-traded funds (ETFs) continue to influence the market.

Read more

US economy: slower growth with stronger inflation

US economy: slower growth with stronger inflation

The dollar strengthened, and stocks fell after statistical data from the US. The focus was on the preliminary estimate of GDP for the first quarter. Annualised quarterly growth came in at just 1.6%, down from the 2.5% and 3.4% previously forecast.

Read more

Forex MAJORS

Cryptocurrencies

Signatures