USD/JPY Price Analysis: Remains confined in a range, above mid-109.00s ahead of US data


  • USD/JPY extended its sideways consolidative price action through the mid-European session.
  • The set-up favours bullish traders and supports prospects for a move beyond the 110.00 mark.
  • Weakness below the 109.35 support area has the potential to drag the pair to sub-109.00 levels.

The USD/JPY pair struggled to capitalize on the previous day's US CPI-inspired strong gains and witnessed a subdued/range-bound price action on Thursday. The was last seen hovering around the 109.50-60 region, just below the one-month tops set earlier today.

A generally softer risk tone extended some support to the safe-haven Japanese yen. On the other hand, a modest pullback in the US Treasury bond yields held the US dollar bulls from placing aggressive bets and further collaborate to cap the upside for the USD/JPY pair.

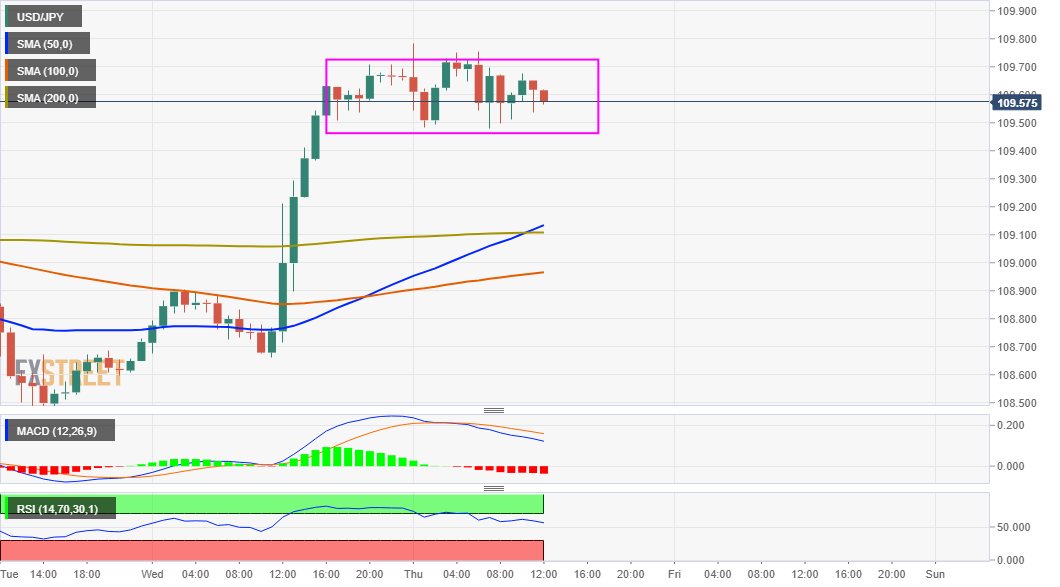
From a technical perspective, the two-way price moves constitute the formation of a rectangle on hourly charts. This suggests indecision over the USD/JPY pair's intraday direction and warrants some caution before positioning for any further appreciating move.

Meanwhile, technical indicators on daily/hourly charts are holding in the bullish territory and support prospects for an eventual breakout on the upside. That said, investors preferred to wait on the sidelines ahead of the Initial Jobless Claims from the US.

From current levels, some follow-through buying has the potential to push the USD/JPY pair back towards the key 110.00 psychological mark. The momentum could further get extended towards the top end of an ascending channel, currently around the 110.25 region.

On the flip side, immediate support is pegged near the 109.35 horizontal resistance breakpoint. Sustained weakness below might turn the USD/JPY pair vulnerable to slide further to the 109.00 mark before bears target the ascending channel support, around the 108.80 region.

USD/JPY 1-hour chart

fxsoriginal

Technical levels to watch

USD/JPY

Overview
Today last price 109.62
Today Daily Change -0.05
Today Daily Change % -0.05
Today daily open 109.67
 
Trends
Daily SMA20 108.7
Daily SMA50 109.03
Daily SMA100 106.79
Daily SMA200 105.93
 
Levels
Previous Daily High 109.71
Previous Daily Low 108.6
Previous Weekly High 109.7
Previous Weekly Low 108.34
Previous Monthly High 110.85
Previous Monthly Low 107.48
Daily Fibonacci 38.2% 109.28
Daily Fibonacci 61.8% 109.02
Daily Pivot Point S1 108.94
Daily Pivot Point S2 108.21
Daily Pivot Point S3 107.83
Daily Pivot Point R1 110.05
Daily Pivot Point R2 110.43
Daily Pivot Point R3 111.16


Share: Feed news

Information on these pages contains forward-looking statements that involve risks and uncertainties. Markets and instruments profiled on this page are for informational purposes only and should not in any way come across as a recommendation to buy or sell in these assets. You should do your own thorough research before making any investment decisions. FXStreet does not in any way guarantee that this information is free from mistakes, errors, or material misstatements. It also does not guarantee that this information is of a timely nature. Investing in Open Markets involves a great deal of risk, including the loss of all or a portion of your investment, as well as emotional distress. All risks, losses and costs associated with investing, including total loss of principal, are your responsibility. The views and opinions expressed in this article are those of the authors and do not necessarily reflect the official policy or position of FXStreet nor its advertisers. The author will not be held responsible for information that is found at the end of links posted on this page.

If not otherwise explicitly mentioned in the body of the article, at the time of writing, the author has no position in any stock mentioned in this article and no business relationship with any company mentioned. The author has not received compensation for writing this article, other than from FXStreet.

FXStreet and the author do not provide personalized recommendations. The author makes no representations as to the accuracy, completeness, or suitability of this information. FXStreet and the author will not be liable for any errors, omissions or any losses, injuries or damages arising from this information and its display or use. Errors and omissions excepted.

The author and FXStreet are not registered investment advisors and nothing in this article is intended to be investment advice.

Recommended content


Recommended content

Editors’ Picks

AUD/USD tumbles toward 0.6350 as Middle East war fears mount

AUD/USD tumbles toward 0.6350 as Middle East war fears mount

AUD/USD has come under intense selling pressure and slides toward 0.6350, as risk-aversion intensifies following the news that Israel retaliated with missile strikes on a site in Iran. Fears of the Israel-Iran strife translating into a wider regional conflict are weighing on the higher-yielding Aussie Dollar. 

AUD/USD News

USD/JPY breaches 154.00 as sell-off intensifies on Israel-Iran escalation

USD/JPY breaches 154.00 as sell-off intensifies on Israel-Iran escalation

USD/JPY is trading below 154.00 after falling hard on confirmation of reports of an Israeli missile strike on Iran, implying that an open conflict is underway and could only spread into a wider Middle East war. Safe-haven Japanese Yen jumped, helped by BoJ Governor Ueda's comments. 

USD/JPY News

Gold price jumps above $2,400 as MidEast escalation sparks flight to safety

Gold price jumps above $2,400 as MidEast escalation sparks flight to safety

Gold price has caught a fresh bid wave, jumping beyond $2,400 after Israel's retaliatory strikes on Iran sparked a global flight to safety mode and rushed flows into the ultimate safe-haven Gold. Risk assets are taking a big hit, as risk-aversion creeps into Asian trading on Friday. 

Gold News

WTI surges to $85.00 amid Israel-Iran tensions

WTI surges to $85.00 amid Israel-Iran tensions

Western Texas Intermediate, the US crude oil benchmark, is trading around $85.00 on Friday. The black gold gains traction on the day amid the escalating tension between Israel and Iran after a US official confirmed that Israeli missiles had hit a site in Iran.

Oil News

Dogwifhat price pumps 5% ahead of possible Coinbase effect

Dogwifhat price pumps 5% ahead of possible Coinbase effect

Dogwifhat price recorded an uptick on Thursday, going as far as to outperform its peers in the meme coins space. Second only to Bonk Inu, WIF token’s show of strength was not just influenced by Bitcoin price reclaiming above $63,000.

Read more

Forex MAJORS

Cryptocurrencies

Signatures