|

USD/JPY Price Analysis: Hovers around 143.20 ahead of FOMC’s meeting

  • USD/JPY fluctuates around 143.00 amid a negative market sentiment, spurred by recession fears on Fed’s aggressive tightening path.
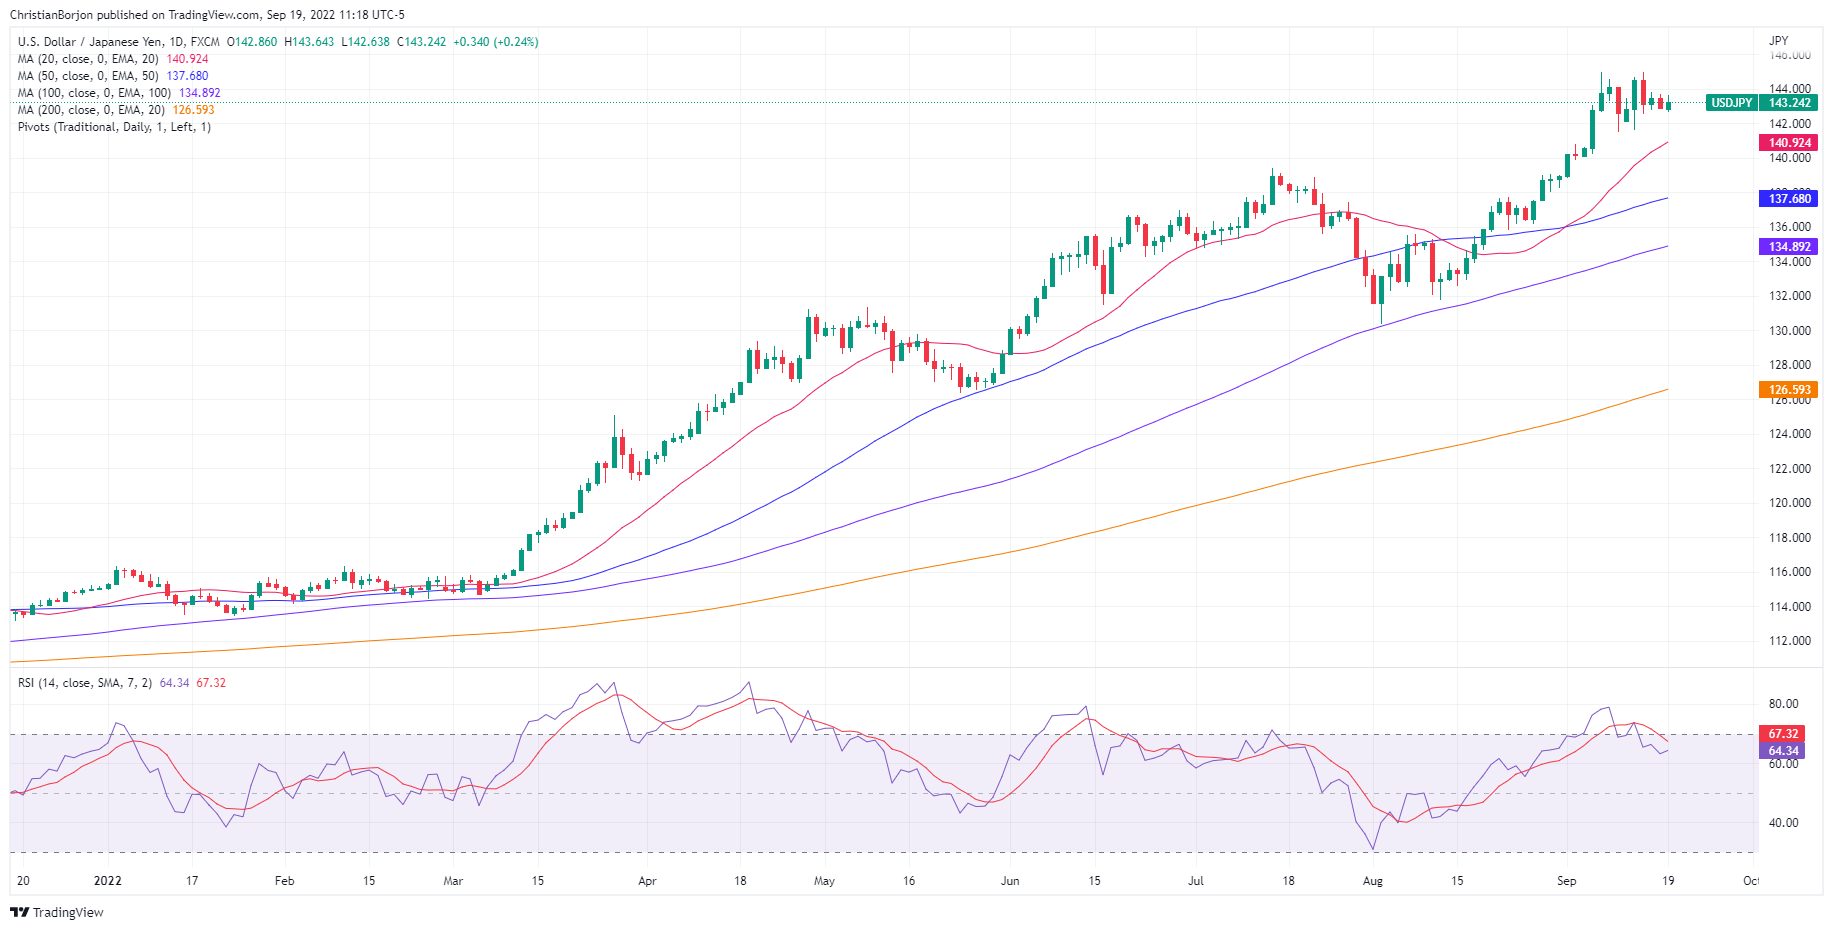
  • The USD/JPY daily chart portrays buyers in control, but price action remains constrained.
  • Short term, the USD/JPY is range-bound, trapped in the 142.60-143.60 range.

The USD/JPY seesaws around 24-year highs above the 143.00 psychological level, for the third consecutive trading session, amidst a risk-off impulse, courtesy of fears that the Fed’s aggression would likely tip the US economy into a recession. At the time of writing, the USD/JPY is trading at 143.24, above its opening price by 0.24%.

USD/JPY Price Analysis: Technical outlook

The USD/JPY daily chart keeps illustrating that buyers are in charge, albeit price action remains subdued. The daily moving averages (DMAs) reside below the exchange rate, while the Relative Strength Index (RSI) exited from overbought conditions, a respite for US dollar buyers that would like to re-test the USD/JPY year-to-date high at around 145.00. However, it should be noted that once 143.00 gives way, it would pave the way for a fall towards the 20-day EMA at 140.92.

Short term, the four-hour scale depicts the USD/JPY sideways, trapped in the 142.50-143.60 range. Oscillators led by the Relative Strength Index (RSI) is almost flat, hoovering around the 50-midline, displaying that neither buyers nor sellers are committed to opening fresh bets against the rise/fall of the major.

On the upside, the USD/JPY first resistance would be 144.00, ahead of the YTD high at around 144.99. on the flip side, the USD/JPY first support would be the daily pivot at 143.15, followed by the psychological 143.00, ahead of the S1 pivot point at 142.61.

USD/JPY Key Technical Levels

USD/JPY

Overview
Today last price143.24
Today Daily Change0.34
Today Daily Change %0.24
Today daily open142.94
 
Trends
Daily SMA20140.65
Daily SMA50137.59
Daily SMA100134.79
Daily SMA200126.47
 
Levels
Previous Daily High143.7
Previous Daily Low142.83
Previous Weekly High144.96
Previous Weekly Low141.66
Previous Monthly High139.08
Previous Monthly Low130.4
Daily Fibonacci 38.2%143.16
Daily Fibonacci 61.8%143.36
Daily Pivot Point S1142.61
Daily Pivot Point S2142.29
Daily Pivot Point S3141.75
Daily Pivot Point R1143.48
Daily Pivot Point R2144.02
Daily Pivot Point R3144.34

Author

Christian Borjon Valencia

Markets analyst, news editor, and trading instructor with over 14 years of experience across FX, commodities, US equity indices, and global macro markets.

More from Christian Borjon Valencia
Share:

Editor's Picks

EUR/USD remains offered below 1.1600, seems vulnerable near multi-month low

The EUR/USD pair struggles to capitalize on the overnight bounce from the 1.1530 region, or the lowest level since November 2025, and lower for the third consecutive day on Wednesday. Spot prices slide back below the 1.1600 mark during the Asian session and seem vulnerable to slide further.

GBP/USD slips below key averages as geopolitical risks mount

GBP/USD fell about 0.35% on Tuesday, settling around 1.3350 after slipping below the 200-day Exponential Moving Average for the first time since early December. The pair has pulled back sharply from its late-January high near 1.3870, shedding over 500 pips in a series of lower highs and lower lows. 

Gold rebounds ahead of US ADP, will it last?

Gold finds renewed Asian bids and retests $5,230 early Wednesday after the heavy sell-off on Tuesday. The US Dollar stands tall amid escalating Middle East tensions and reduced dovish Fed expectations. Gold defends $5,000 or 50% Fibo level after facing rejection at the 78.6% Fibo resistance at $5,342 amid bullish RSI.  

Bitcoin, Ethereum and Ripple struggle for direction as consolidation persists

Bitcoin, Ethereum and Ripple prices trade with a cautious tone at the time of writing on Wednesday as upside momentum continues to fade across the broader crypto market. BTC remains within a parallel channel, ETH struggles below key resistance, while XRP remains fragile within a descending channel. These top three cryptocurrencies by market capitalization continue to struggle to establish a directional bias amid the consolidation phase.

Energy shock 2.0: Why rising Gas prices could hit the Euro

Even without a confirmed, sustained disruption, the mere risk to a key global energy chokepoint is enough to inject a significant premium into European Gas markets. And for the Euro, that matters.

Ripple falters amid sell-off jitters and negative funding rates

Ripple (XRP) has come under pressure, drifting lower to $1.35 at the time of writing on Tuesday. The over 2% correction looks poised to erase the previous day’s gains, which lifted the remittance token to $1.42.