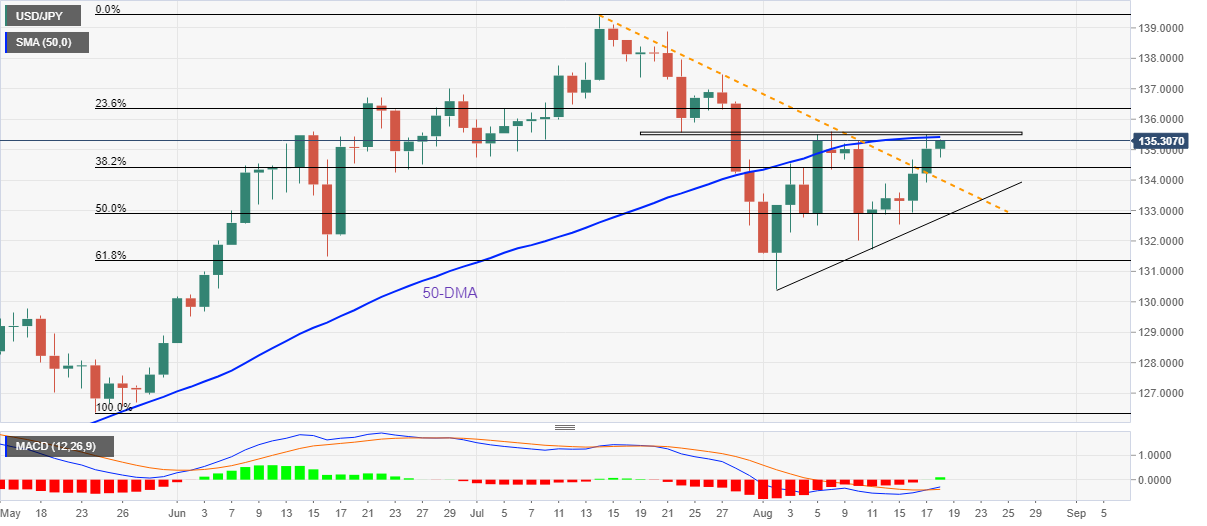
USD/JPY Price Analysis: Further upside hinges on 135.55 break
- USD/JPY prints three-day uptrend, firmer around weekly top.
- Sustained break of monthly resistance line, bullish MACD signal favor buyers.
- Bears should wait for a confluence of ascending triangle for conviction.

USD/JPY picks up bids to refresh intraday high around 135.20 during early Thursday morning in Europe.
In doing so, the yen pair rises for the third consecutive day while justifying the previous day’s upside break of the descending resistance line from mid-July, now support around 134.00.
Also keeping the buyers hopeful is the strongest bullish signal since late June.
However, the 50-DMA and a horizontal area comprising multiple levels marked since July 22, respectively around 135.40 and 135.50-55, appear tough nut to crack for the USD/JPY buyers.
Following that, a north-run towards June’s monthly high near 137.00 becomes imminent.
If at all the USD/JPY prices remain firmer past 137.00, the yearly top marked in July, around 139.40, will be in focus.
Alternatively, pullback moves remain unimpressive until staying beyond the resistance-turned-resistance line, at 134.00.
Even so, a convergence of the two-week-old ascending trend line and 50% Fibonacci retracement level of May-July upside, near 132.90-85, becomes crucial support to watch as a break of which will confirm the ascending triangle bearish chart pattern.
USD/JPY: Daily Chart
Trend: Further upside expected
Author

Anil Panchal
FXStreet
Anil Panchal has nearly 15 years of experience in tracking financial markets. With a keen interest in macroeconomics, Anil aptly tracks global news/updates and stays well-informed about the global financial moves and their implications.


