|

USD/JPY Price Analysis: Failure at 135.00 to pave the way for a pullback towards 131.00

  • On Friday, the USD/JPY climbs 0.11%, and in the week, 2.80%.
  • Risk-aversion initially weighed on the USD, but late in the North American session, higher US Treasury yields lifted the USD/JPY.
  • USD/JPY Price Analysis: The USD/JPY might retrace as intervention looms, towards 131.00s.

The USD/JPY is registering gains close to 2.80% during the week, and on Friday is edging up after reaching a daily low at 133.36, following the statement’s release by Japanese authorities, which acknowledged the yen weakness. The pair fell, though late as the New York session wanes, recovered, and the USD/JPY is trading at 134.43, up 0.11%.

Wall Street finished the last trading day of the week with losses between 2.53% and 3.56%, portraying the dismal market mood. Meanwhile, US Treasuries rose, with the 10-year benchmark note up at 3.163%, gaining 11 basis points. The greenback followed suit, with the US Dollar Index rallying towards 104.185, up by 0.85%.

USD/JPY Price Analysis: Technical outlook

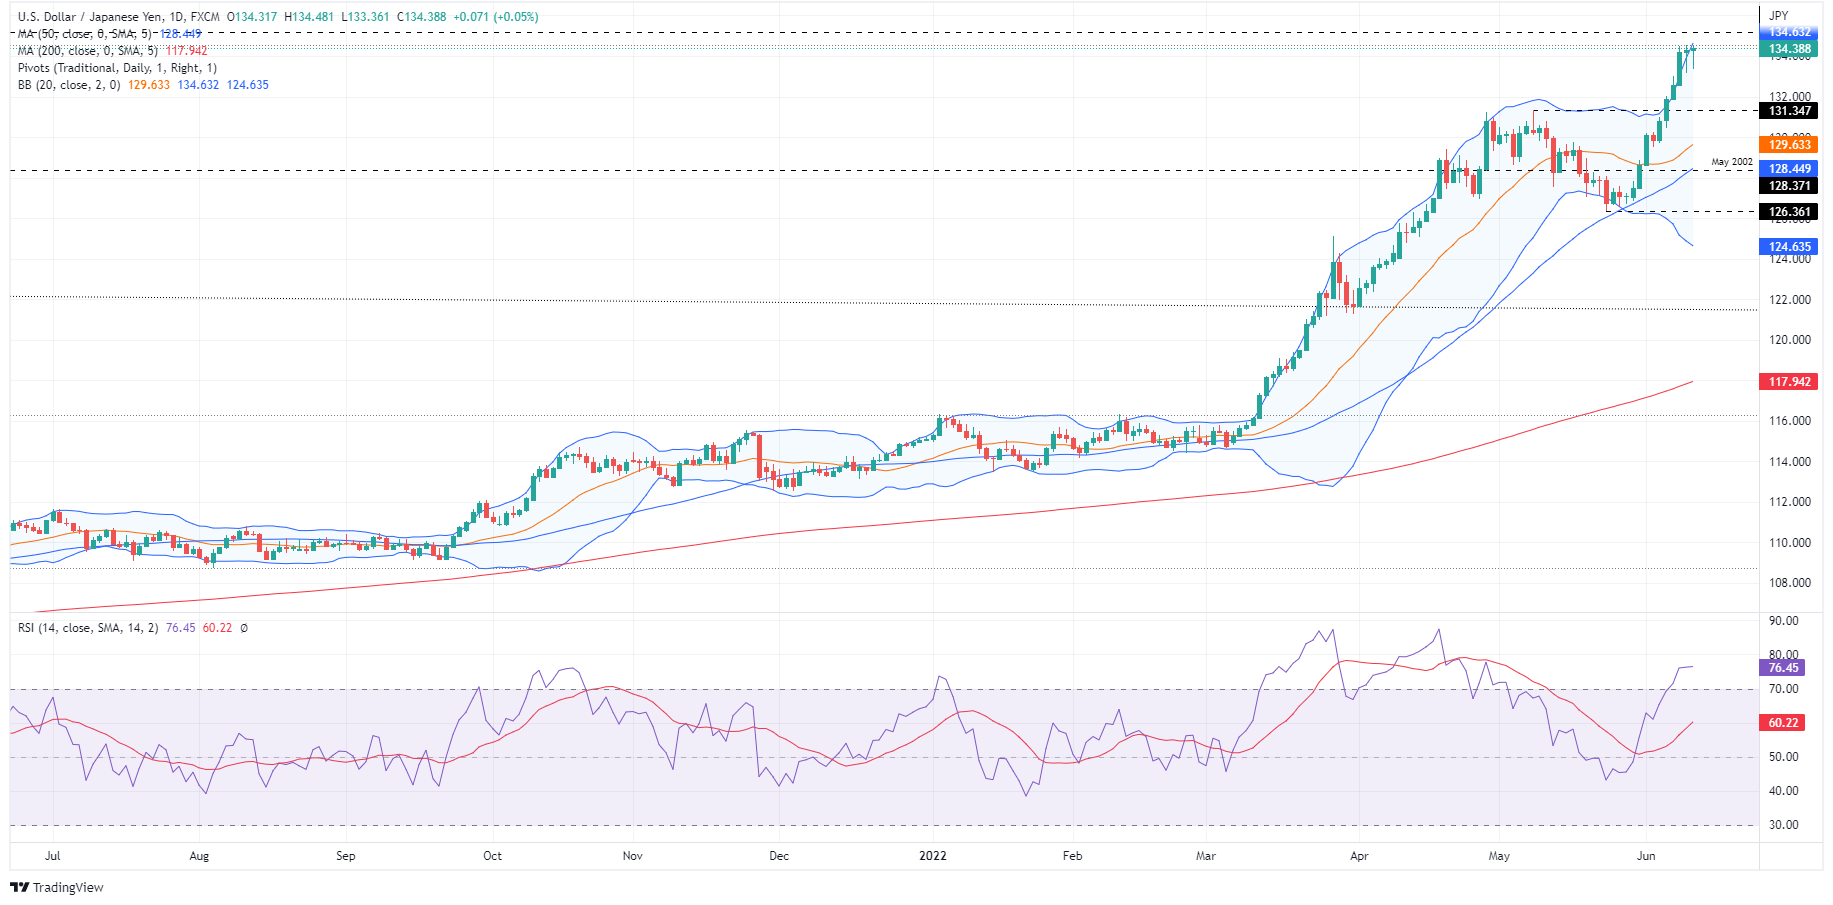
The major’s daily chart illustrates that the uptrend remains intact, though the rally appears overextended. The top Bollinger band, at 134.62, would be a challenging resistance level to overcome. The Relative Strength Index (RSI) making lower higher-highs, contrary to the USD/JPY’s price action, might create a negative divergence. That said, the USD/JPY might pull back towards the 131.00 area as JPY’s weakness begins to gather Japanese authorities’ attention near the 135.00 mark.

Therefore, the USD/JPY’s first support would be June’s 9 daily low at 133.18. A breach of the latter would expose June’s 8 low at 132.54. Once cleared, the USD/JPY’s next demand zone would be May 9 high-turned-support at 131.34.

Key Technical Levels

USD/JPY

Overview
Today last price134.42
Today Daily Change0.08
Today Daily Change %0.06
Today daily open134.34
 
Trends
Daily SMA20129.41
Daily SMA50128.24
Daily SMA100122.48
Daily SMA200117.84
 
Levels
Previous Daily High134.56
Previous Daily Low133.19
Previous Weekly High130.98
Previous Weekly Low126.95
Previous Monthly High131.35
Previous Monthly Low126.36
Daily Fibonacci 38.2%134.03
Daily Fibonacci 61.8%133.71
Daily Pivot Point S1133.5
Daily Pivot Point S2132.66
Daily Pivot Point S3132.13
Daily Pivot Point R1134.87
Daily Pivot Point R2135.4
Daily Pivot Point R3136.24

Author

Christian Borjon Valencia

Markets analyst, news editor, and trading instructor with over 14 years of experience across FX, commodities, US equity indices, and global macro markets.

More from Christian Borjon Valencia
Share:

Editor's Picks

AUD/USD falls to near 0.7100 after slipping below 50-day EMA

AUD/USD depreciates after registering minor gains in the previous day, trading around 0.7120 during the Asian hours. The technical analysis of the daily chart shows the pair consolidating sideways within a rectangle pattern, as neither bulls nor bears gain control. The AUD/USD pair is holding a slight bearish tone however as it sits beneath both the nine-day and 50-day EMAs.

160.00: USD/JPY back near intervention territory after upbeat US jobs report

US Nonfarm Payrolls beat expectations by a wide margin in May, with 172K jobs added. The US Dollar rebounds after the release, helping USD/JPY recover from its intraday lows. Warnings from Japanese authorities continue to limit upside potential near the 160.00 threshold.

Gold targets $4,300 amid stronger Dollar

Gold faces increasing selling interest and navigates the area of three-month lows near the $4,300 mark per troy ounce on Friday. The precious metal’s decline comes as traders assess the stronger-than-expected NFP, while the bid bias in the Greenback and higher US Treasury yields also collaborate with the retracement.

Cardano hits five-year low even as Hoskinson clarifies "break" isn't an exit

Cardano (ADA) price is down 10% at press time on Friday, extending losses over 30% so far this week amid Charles Hoskinson's clarification that "break" isn't an exit.

Week ahead – Fed countdown begins amid US inflation data and geopolitical risks

Fed Chair Warsh’s first meeting approaches as key US inflation data could reshape expectations. Oil prices remain elevated as US-Iran talks continue; tariffs also return to the spotlight. ECB is expected to hike; will it be a one-off move or is July live?

The US economy defies the rules: 100 days into the Oil shock and the recession signal is still missing

More than three months after the start of the Iran war and the resulting disruption to global energy markets, the US economy continues to display remarkable resilience. The conflict has triggered a sharp rise in Oil prices, reignited inflationary pressures and fueled widespread concerns about a potential economic slowdown.