USD/JPY Price Analysis: Climbs back closer to mid-147.00s, eyes YTD peak ahead of US CPI
- USD/JPY scales higher for the second successive day and climbs to a fresh weekly high on Wednesday.
- This week's rebound from the ascending trend-line support and the subsequent move up favour bulls.
- Intervention fears might hold back bulls from placing aggressive bets ahead of the crucial US CPI report.

The USD/JPY pair builds on this week's bounce from ascending trend-line support extending from the 138.00 mark, or the late July swing low, and gains some positive traction for the second successive day on Wednesday. Spot prices touch a fresh weekly top, around the 147.45 area during the Asian session, and remain well within the striking distance of the YTD peak set last Thursday.
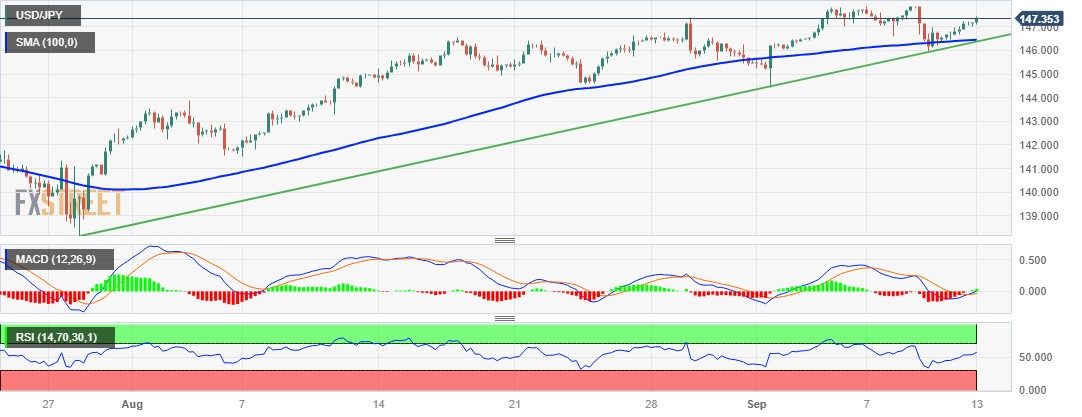
The aforementioned trend-line support is currently pegged near the 146.40-146.35 region, which now coincides with the 100-period Simple Moving Average (SMA) on the 4-hour chart. This, in turn, should act as a pivotal point for short-term traders as the focus remains glued to the release of the latest US consumer inflation figures, due later during the early North American session. In the meantime, oscillators on the 4-hour chart have just started gaining positive traction. This, along with the fact that technical indicators on the daily chart are holding comfortably in the bullish territory, suggests that the path of least resistance for the USD/JPY pair is to the upside.
Hence, a subsequent strength back towards testing 147.85 region, or the highest level since November 2022, looks like a distinct possibility. Some follow-through buying beyond the 148.00 round-figure mark will be seen as a fresh trigger for bullish traders and pave the way for additional gains. The USD/JPY pair might then accelerate the momentum towards the 148.70-148.80 hurdle before aiming to conquer the 148.00 mark for the first time since October 2022. That said, speculations that Japanese authorities might interfere in the FX market to prop up the domestic currency might hold back bulls from placing fresh bets and cap any further gains for spot prices.
On the flip side, the 147.00 round figure now seems to protect the immediate downside ahead of the 146.35 confluence support. A convincing break below the latter might prompt aggressive technical selling and set the stage for a deeper corrective decline. The subsequent fall has the potential to drag the USD/JPY pair further below the 146.00 mark, towards testing the 145.30 intermediate support en route to the 145.00 psychological mark and the monthly swing low, around the 144.45 zone.
USD/JPY 4-hour chart
Technical levels to watch
Author

Haresh Menghani
FXStreet
Haresh Menghani is a detail-oriented professional with 10+ years of extensive experience in analysing the global financial markets.


