|

USD/JPY Price Analysis: Buyers react to a bullish-doji in the daily chart

  • Based on a softer US inflation report, USD/JPY climbs during the week by 1.14%, after a volatile last three days.
  • USD/JPY is neutral biased, but a doji emerging in the daily chart could pave the way for further upside.
  • In the near term, the major is sideways, though oscillators point upwards, so it is slightly skewed to the upside.

The USD/JPY slightly climbed on Thursday following the release of the University of Michigan Consumer Sentiment for August, which exceeded estimations, but consumer expectations of inflation remained mixed. Nevertheless, it was not an excuse for investors seeking return, shifting toward riskier assets, to the detriment of safe-haven assets. At the time of writing, the USD/JPY is trading at 133.48 above its opening price by 0.39%.

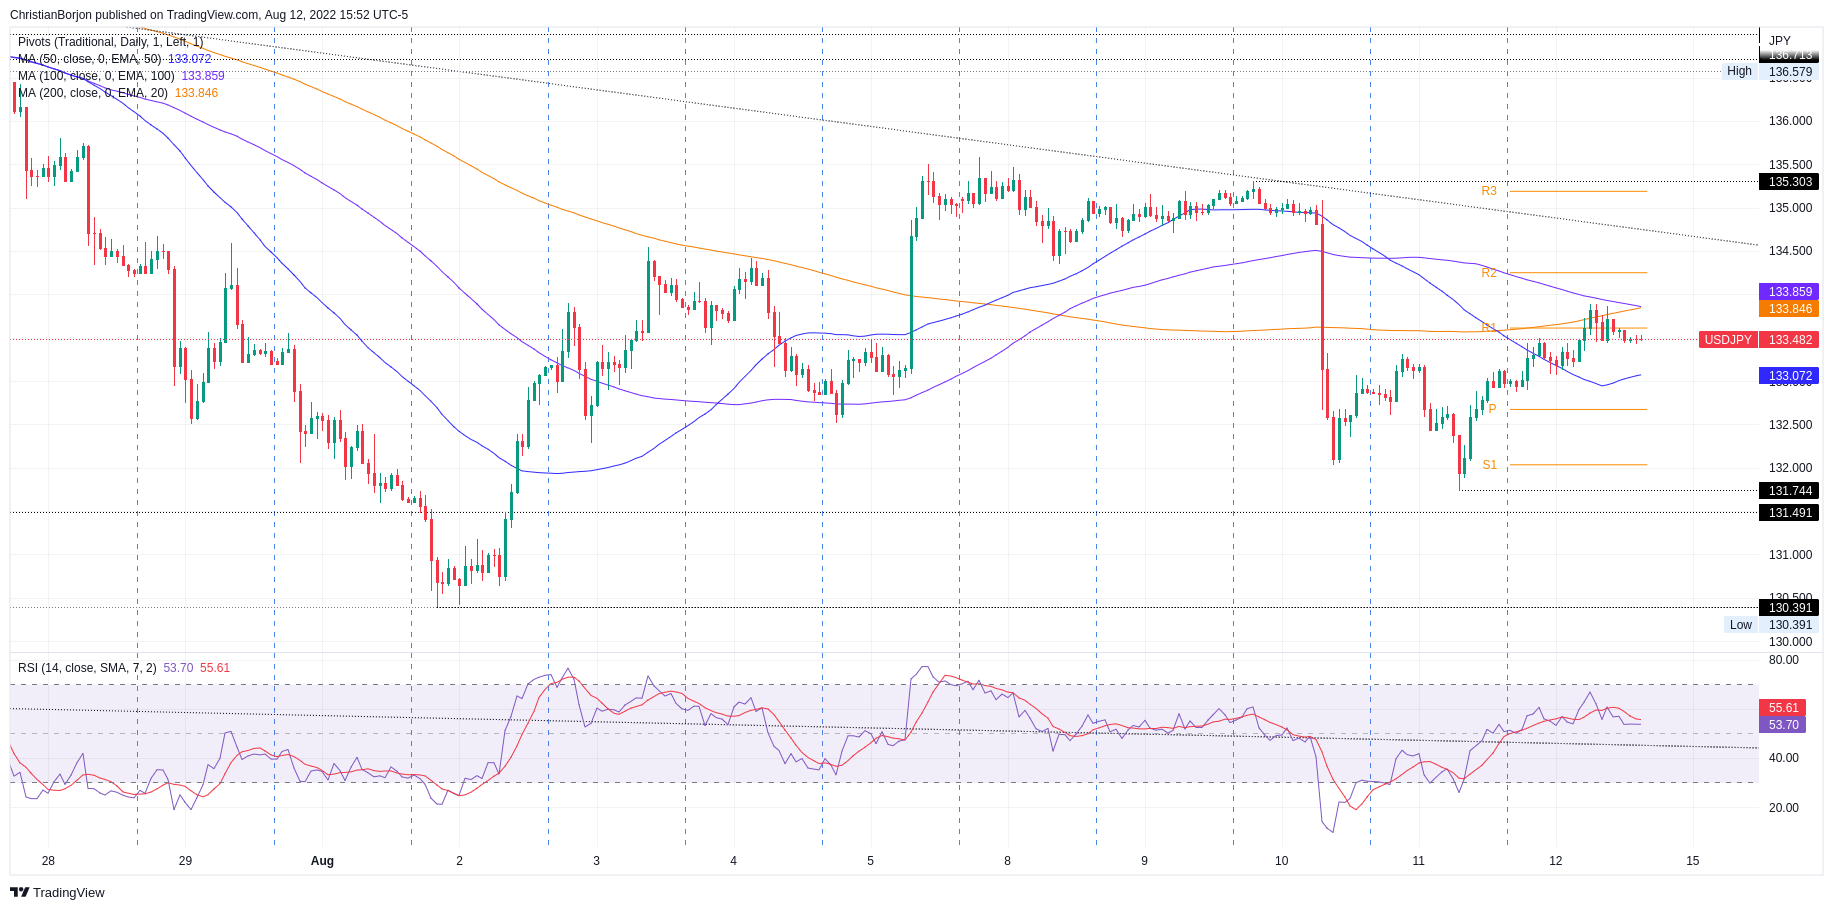
USD/JPY Price Analysis: Technical outlook

The USD/JPY daily chart portrays Thursday’s price action formed a doji, preceded by a downtrend, indicating that the downtrend is losing steam. Worth noticing the Relative Strength Index accelerated its uptrend to the 50-midline, showing that buying pressure is picking up. Nevertheless, the major remains sideways unless buyers reclaim the 50-day EMA at 135.29.

In the near term, the USD/JPY hourly chart the pair as neutral. However, price action since late Wednesday shows that the pair has begun trading upwards, but at a steady pace, as shown by the Relative Strenght Index (RSI), which could mean some things: USD/JPY shorts booking profits, after a stellar run of 700 pips downwards, and buyers slowly beginning to add to their longs, in speculation of higher US 10-year bond yield rates.

Therefore, the USD/JPY is sideways. Upwards, the major’s first resistance would be the confluence of the 100 and 200-hour EMAs at 133.84-85, followed by the 135.00 figure, followed by the August 10 high at 135.30.

On the flip side, the USD/JPY first support would e the 50-hour EMA at 133.07. The break below exposes crucial demand zones, the August 11 pivot low at 131.73, followed by the August 2 low at 130.39.

USD/JPY Hourly chart

USD/JPY Key Technical Levels

USD/JPY

Overview
Today last price133.5
Today Daily Change0.47
Today Daily Change %0.35
Today daily open133.03
 
Trends
Daily SMA20135.35
Daily SMA50135.27
Daily SMA100131.24
Daily SMA200123.16
 
Levels
Previous Daily High133.31
Previous Daily Low131.73
Previous Weekly High135.5
Previous Weekly Low130.4
Previous Monthly High139.39
Previous Monthly Low132.5
Daily Fibonacci 38.2%132.71
Daily Fibonacci 61.8%132.34
Daily Pivot Point S1132.07
Daily Pivot Point S2131.11
Daily Pivot Point S3130.49
Daily Pivot Point R1133.65
Daily Pivot Point R2134.27
Daily Pivot Point R3135.23

Author

Christian Borjon Valencia

Markets analyst, news editor, and trading instructor with over 14 years of experience across FX, commodities, US equity indices, and global macro markets.

More from Christian Borjon Valencia
Share:

Editor's Picks

EUR/USD remains weak near 1.1800

EUR/USD rapidly fades Tuesday’s uptick and resumes its weekly retracement, challenging the 1.1800 support at the end of the NA session on Wednesday. The pair’s drop comes in response to extra gains in the US Dollar. Moving forward, the ECB meets on Thursday and is seen leaving its policy rate unchanged.
 

GBP/USD flirts with daily lows near 1.3640

GBP/USD is giving back Tuesday’s gains on Wednesday, facing renewed selling pressure and drifting towards the 1.3640 zone, or daily lows. The pullback comes as the Greenback picks up some decent traction, while investors position ahead of the BoE’s Super Thursday.

Gold stays offered below $5,000

Gold is back under pressure on Wednesday, slipping below the $5,000 mark per troy ounce as Wednesday’s session draws to a close. The pullback comes amid renewed strength in the US Dollar alongside mixed moves in US Treasury yields across the curve.

Dogecoin Price Forecast: DOGE plummets as retail investors exit amid broad market sell-off

Dogecoin (DOGE) holds near support at $0.1000 at the time of writing on Wednesday, as bears tighten their grip on assets across the crypto market. The leading meme coin remains on the back foot, weighed down by risk-off sentiment, low retail activity and weak technicals.

Should investors abandon AI as software stocks slide?

AI is not being abandoned by markets. It is being priced more carefully. Over the past few weeks, the underperformance of software and SaaS stocks has sparked a familiar question: is the AI trade breaking down? The answer is no. 

Ripple stabilizes amid mixed signals as ETF inflows resume despite low retail activity

Ripple hovers around the $1.60 pivotal level at the time of writing on Wednesday, reflecting stable but weak sentiment across the crypto market. Intense volatility triggered a brief sell-off on Tuesday, driving the remittance token to pick up liquidity at $1.53 before recovering to the current level.