|

USD/JPY Price Analysis: Bulls move in and target 133.00 ahead of the 200-DMA

  • USD/JPY gapped up since the Asian session by about 30 pips, reaching a daily high of 132.90.
  • USD/JPY Price Analysis: Neutral biased, but tilted upwards, with bulls eyeing 133.00.

The USD/JPY gapped toward new 5-week highs shy of the 50-day Exponential Moving Average (EMA) by just two pips at 132.89 and remained nearby, about to challenge the 133.00 psychological price level. The last US jobs report crushed estimates, bolstering the US Dollar (USD) on speculations for further Federal Reserve’s (Fed) aggression. Therefore, the USD/JPY rallied 3.45% since Friday and exchanged hands at 132.79 after hitting a low of 131.51.

USD/JPY Price Analysis: Technical outlook

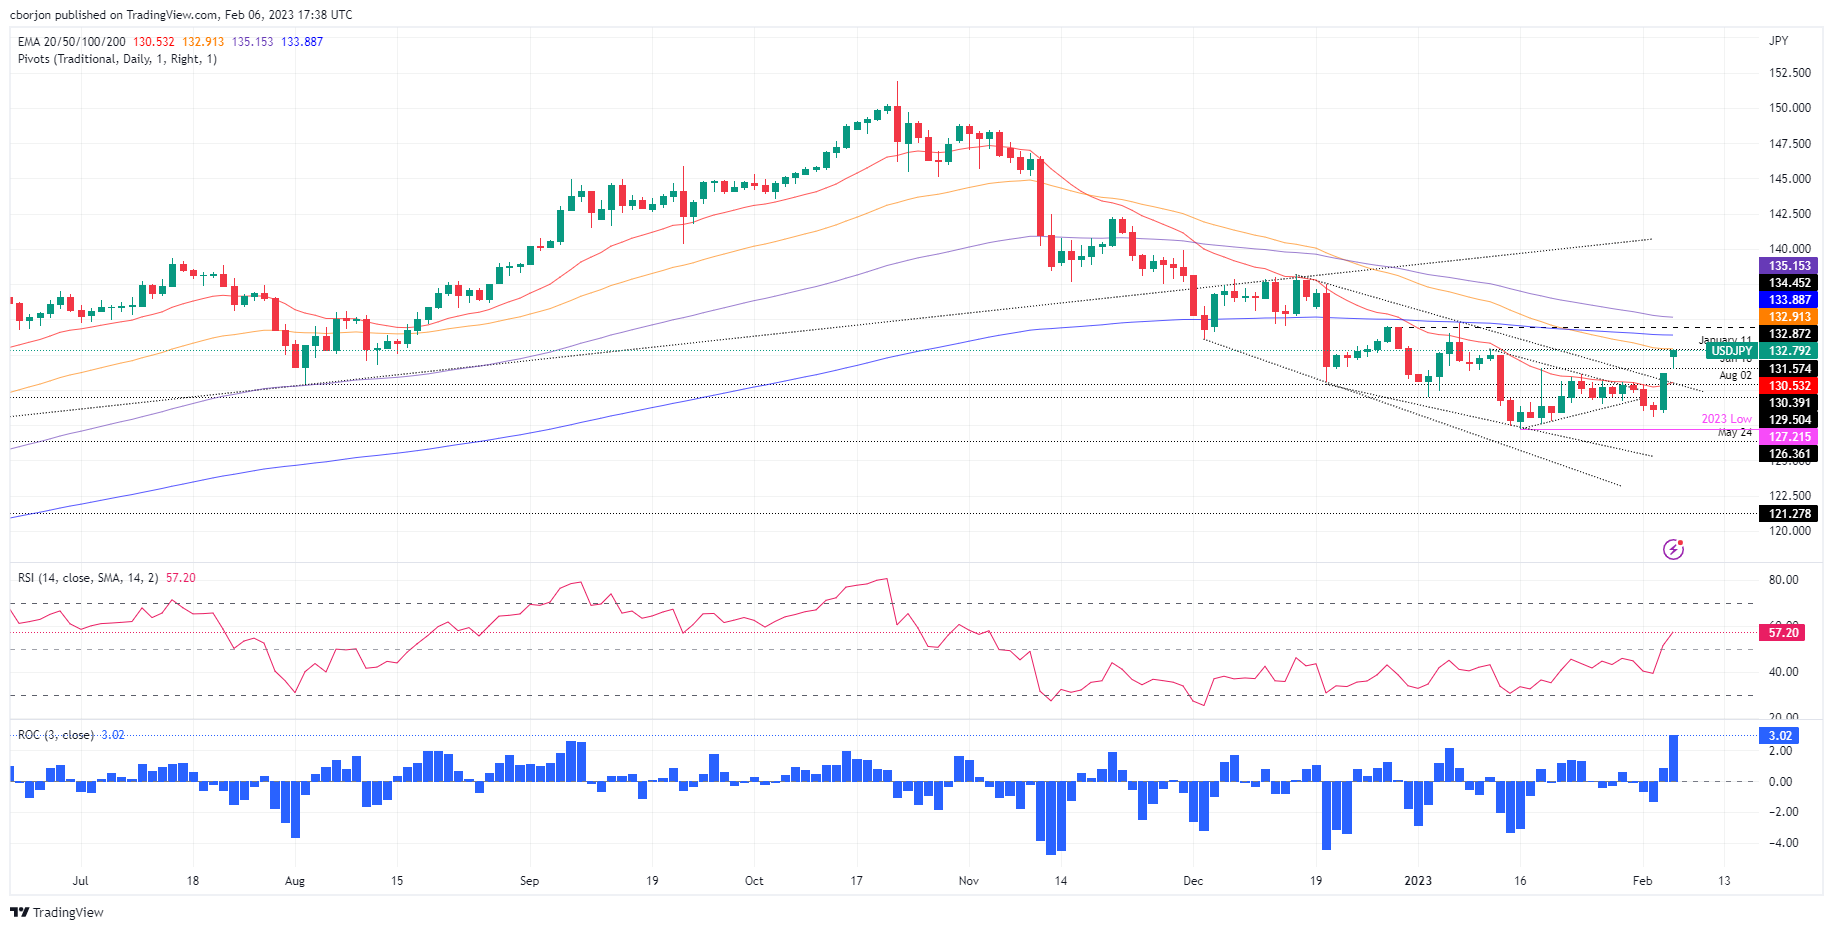
The USD/JPY shifted neutral biased after gapping up from around 131.20 to current exchange rates. On its way up, the major reclaimed the 20-day Exponential Moving Average (EMA) at 130.53, and it’s poised to crack the 50-day EMA at 132.91, ahead of the 133.00 figure.

With the Relative Strength Index (RSI) and the Rate of Change (RoC), oscillators shifted bullish, opening the door for further upside. However, it should be said that the USD/JPY would face the trend-setter 200-day EMA at 133.88, which, once cleared, would pave the way to test the 100-day EMA above the 135.00 figure.

As an alternate scenario, the USD/JPY first support would be 132.00. A breach of the latter and the USD/JPY could test the day’s low at 131.51, followed by last Friday’s high at 131.20. Once those demand zones are broken, it would expose the 20-day EMA at 130.29.

USD/JPY Key Technical Levels

USD/JPY

Overview
Today last price132.88
Today Daily Change1.73
Today Daily Change %1.32
Today daily open131.15
 
Trends
Daily SMA20129.86
Daily SMA50132.81
Daily SMA100138.79
Daily SMA200136.79
 
Levels
Previous Daily High131.2
Previous Daily Low128.33
Previous Weekly High131.2
Previous Weekly Low128.08
Previous Monthly High134.78
Previous Monthly Low127.22
Daily Fibonacci 38.2%130.1
Daily Fibonacci 61.8%129.42
Daily Pivot Point S1129.25
Daily Pivot Point S2127.35
Daily Pivot Point S3126.38
Daily Pivot Point R1132.12
Daily Pivot Point R2133.09
Daily Pivot Point R3134.99

Author

Christian Borjon Valencia

Markets analyst, news editor, and trading instructor with over 14 years of experience across FX, commodities, US equity indices, and global macro markets.

More from Christian Borjon Valencia
Share:

Editor's Picks

EUR/USD loses traction after earlier rebound, tests 1.1600

EUR/USD fails to preserve its recovery momentum after rising toward 1.1650 earlier in the day and tests 1.1600. The risk-averse market atmosphere amid the widening conflict in the Middle East and the broad-based US Dollar strength make it difficult for the pair to hold its ground.

GBP/USD stays weak near 1.3350 amid UK stagflation risks

GBP/USD stays in negative territory near 1.3350 in the second half of the day Thursday. The Pound Sterling loses ground amid fears that the United Kingdom economy could face stagflation risks due to higher energy prices, while the US Dollar attracts fresh safe-haven demand, weighing on the pair.

Gold struggles to benefit from risj-aversion, drops toward $5,100

Gold turns south in the American session on Thursday and declines toward $5,100. The persistent US Dollar (USD) strength doesn't allow XAU/USD to gather recovery momentum despite markets remain risks-averse due to the deepening conflict in the Middle East.

Crypto Today: Bitcoin, Ethereum, XRP hold weekly gains despite US-Iran war

The cryptocurrency market is gaining strength on Thursday, building on Wednesday's upswing, which saw Bitcoin reach a weekly high above $74,000. Ethereum and Ripple are moderating their recent gains amid uncertainty stemming from the escalating war in the Middle East.

Markets attempt to rally on positive news from Iran

There’s been an abrupt change in sentiment this morning, European stock markets are higher and oil and gas prices are moderating, after comments from Iran’s deputy minister about pre-conflict talks between Iran and the US.

Cardano Price Analysis: Approaches key trendline amid bearish sentiment

Cardano (ADA) price is approaching its descending trendline around $0.28 at the time of writing, set to shape the next directional move. The derivatives metrics paint a bearish picture, with ADA’s Open Interest continuing to fall and short bets rising among traders.