USD/JPY Price Analysis: Bulls breaking out of bull flag
- USD/JPY bulls moving in on critical resistance.
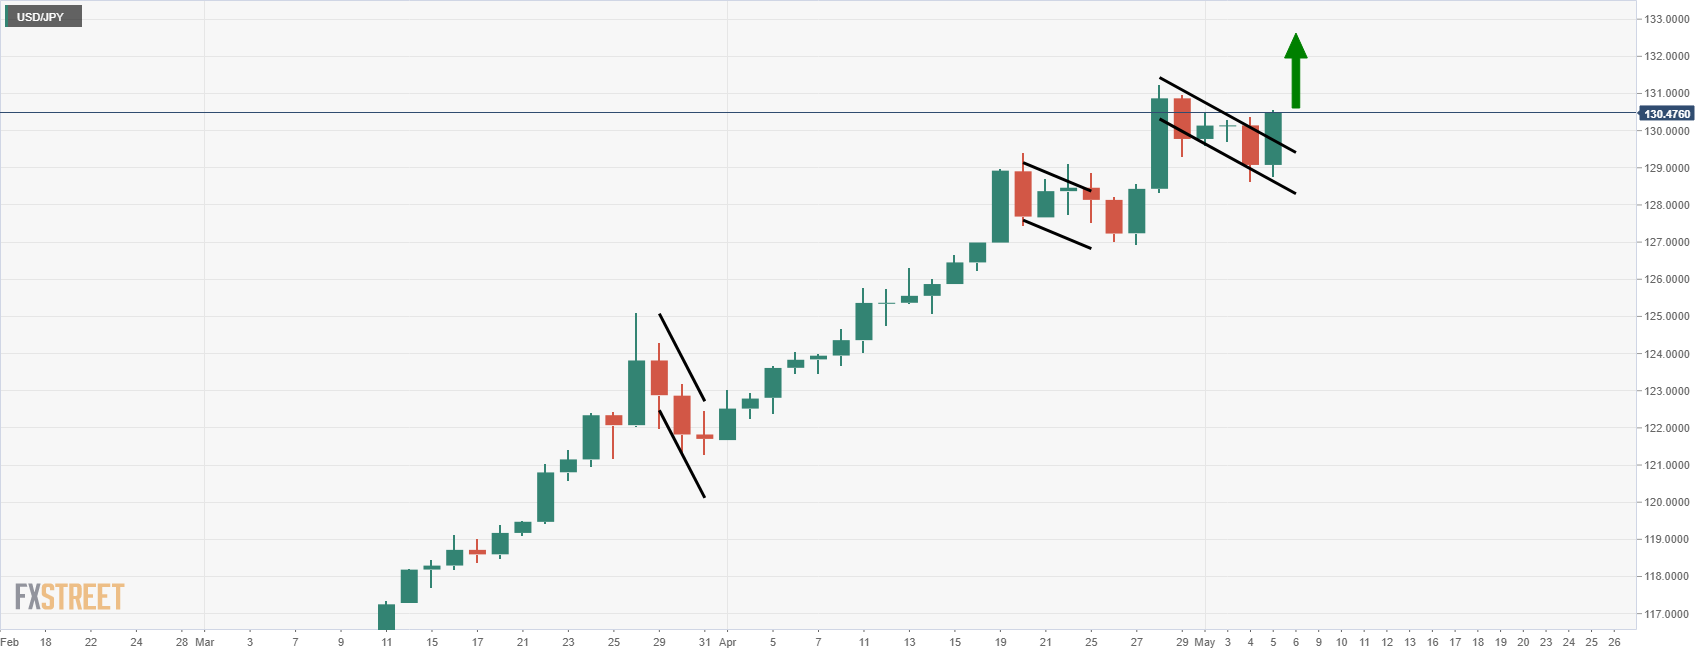
- Bull flag playing out in a trilogy on the daily chart.

As per the prior analysis, USD/JPY Price Analysis: Bears eye a 61.8% golden ratio, USD/JPY moved in on the 61.8% Fibonacci and could now be n the process of making a fresh bull cycle high following last week's bullish weekly close.
Weekly chart
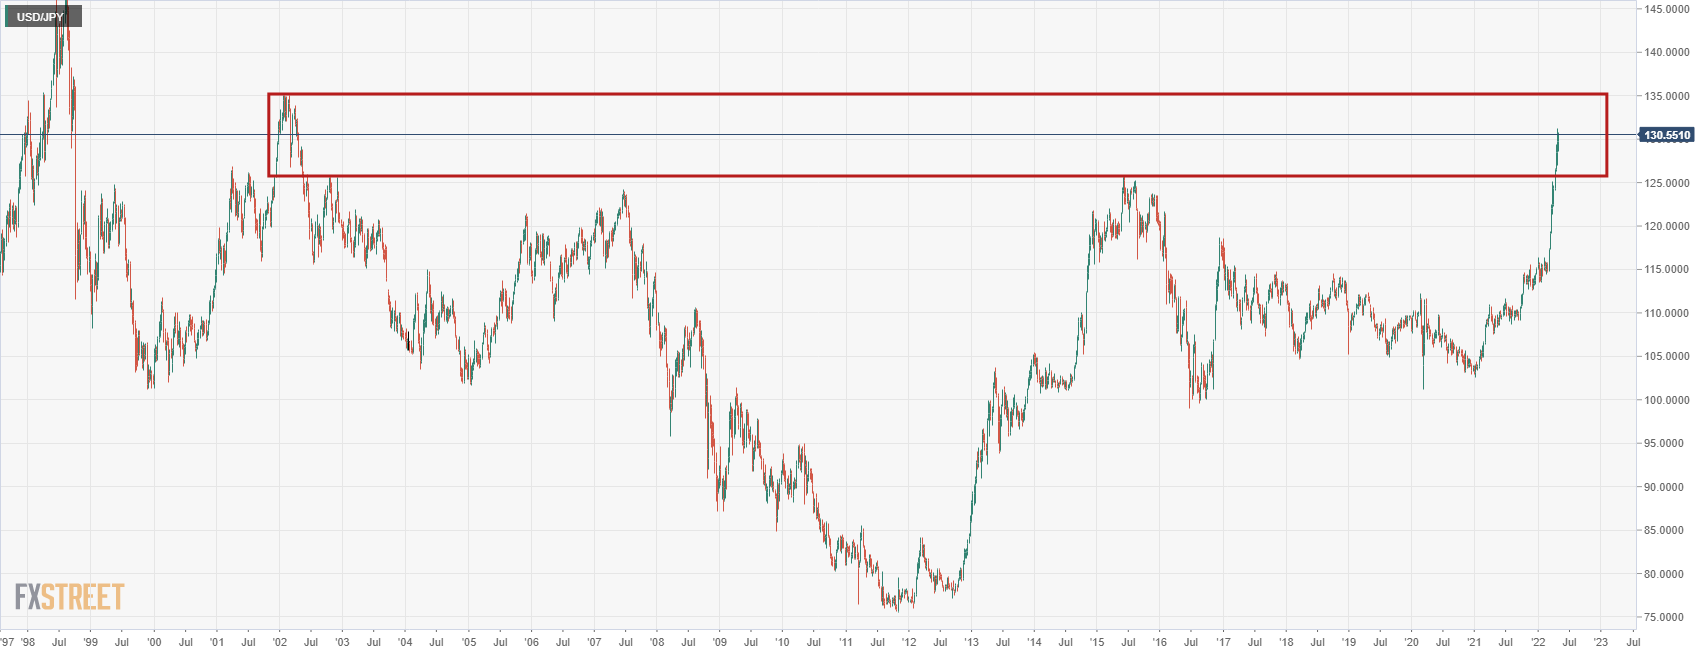
The market is mitigating the imbalance of price from the start of 2002's business. While the weekly rally is relatively overdone and parabolic, a correction may only come should the daily support structure give out.
USD/JPY daily chart
In last week's analysis, USD/JPY Price Analysis: Bullish daily flag breakout is underway, noting the series of bullish flag breakouts, the price has continued to move higher:
(Prior analysis)
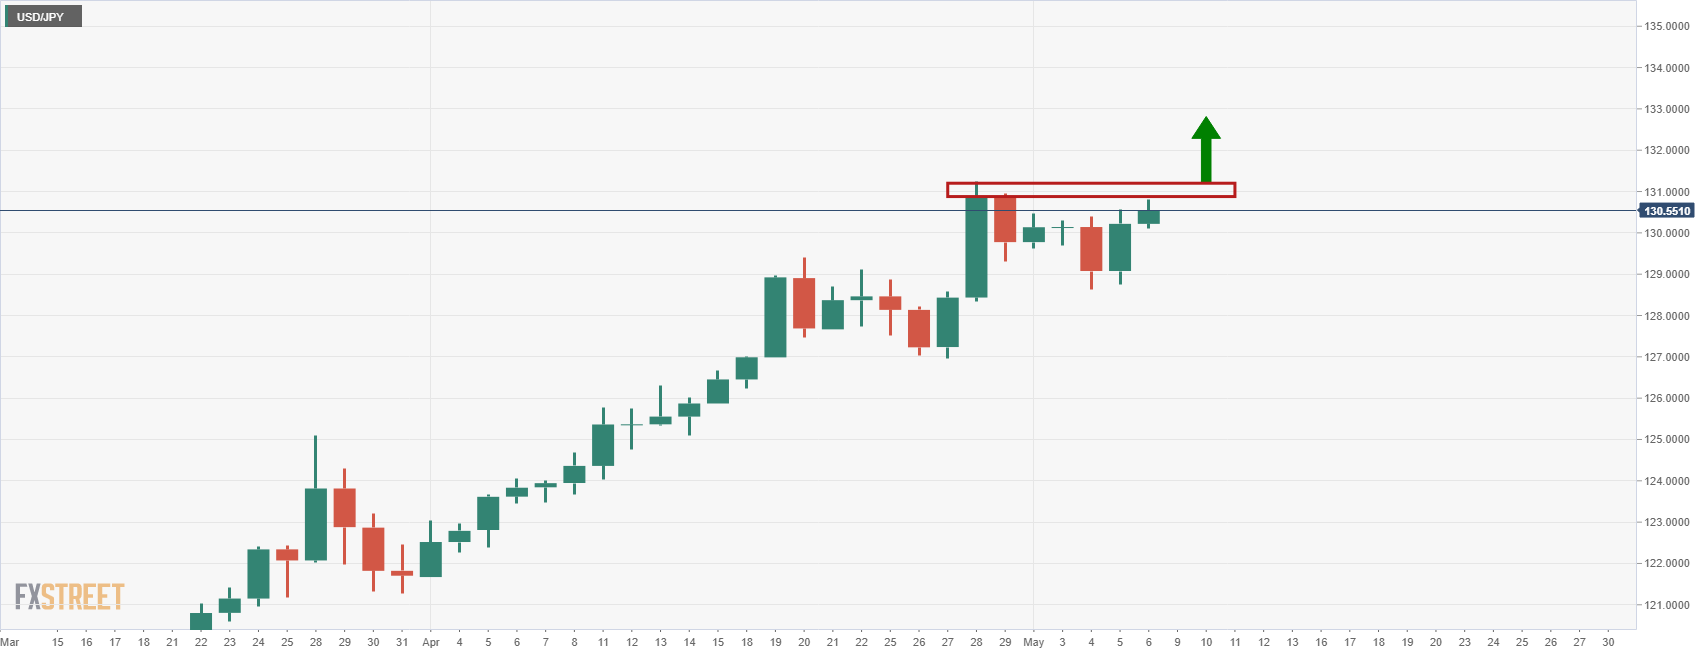
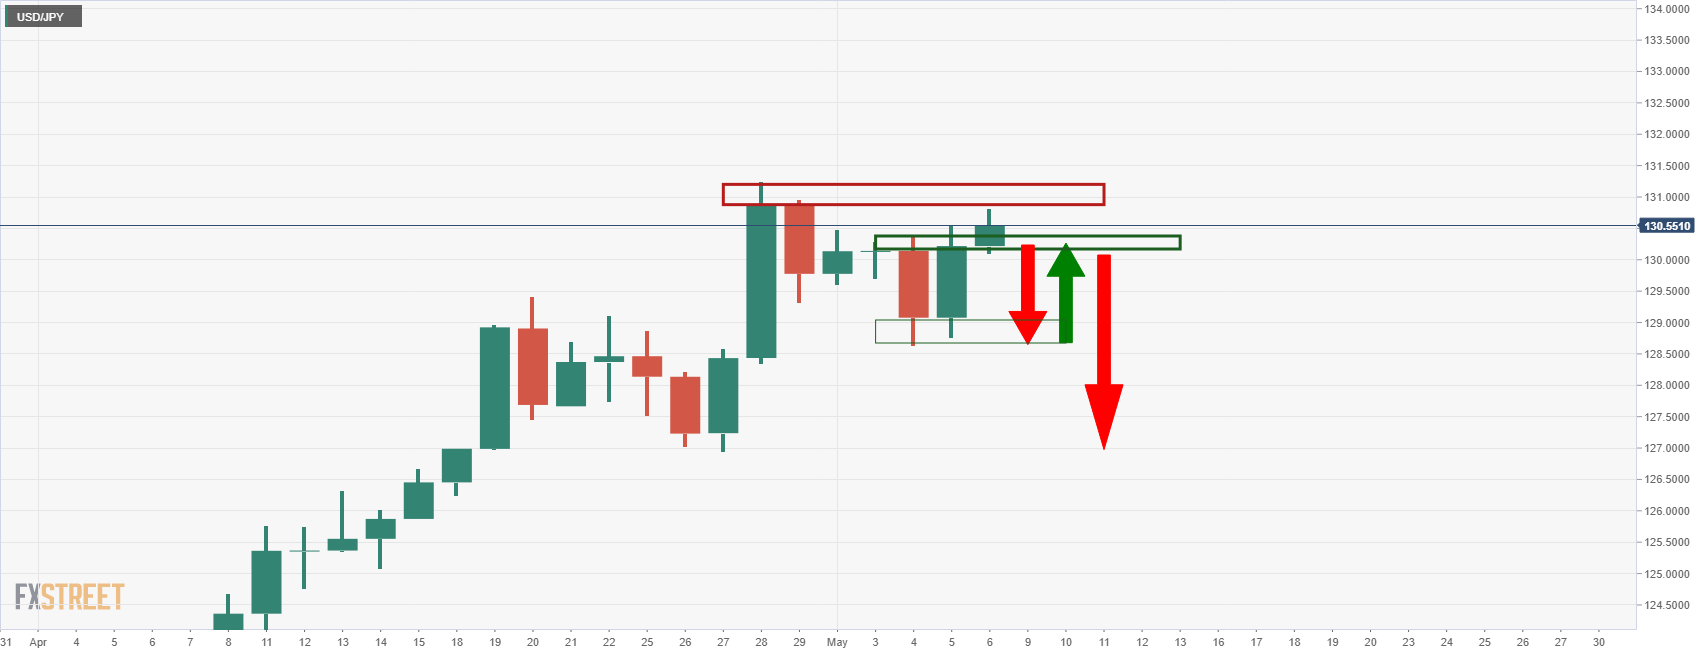
The price is up against resistance for the open but a break there for a fresh daily high could encourage the bulls on the way to the 2002 highs in the 134 area.
However, failing a continuation, a break of 130.14 support and the 128.70 could be the trap door for the forthcoming days:
Author

Ross J Burland
FXStreet
Ross J Burland, born in England, UK, is a sportsman at heart. He played Rugby and Judo for his county, Kent and the South East of England Rugby team.


