USD/JPY Price Analysis: Bullish daily flag breakout is underway
- USD/JPY bulls taking control as the US dollar soars.
- The prior series of bullish flags are encouraging for the current price action.

USD/JPY is on the verge of a bullish breakout according to the daily and hourly chart's structures and price action. The following illustrate the bullish bias across the aforementioned time frames:
USD/JPY daily charts
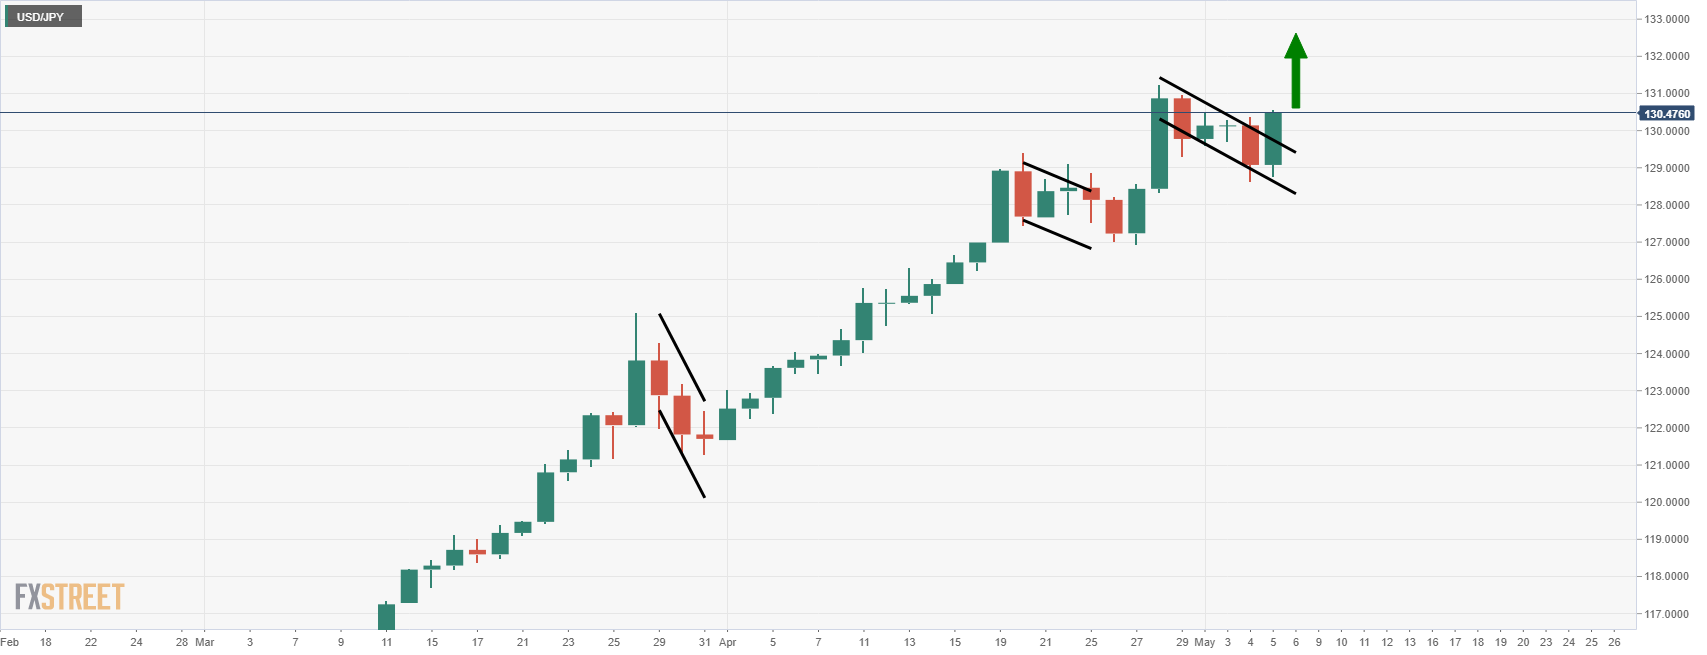
The price has been making a series of higher highs following a bull flag breakout within the bullish US dollar cycle as illustrated above.
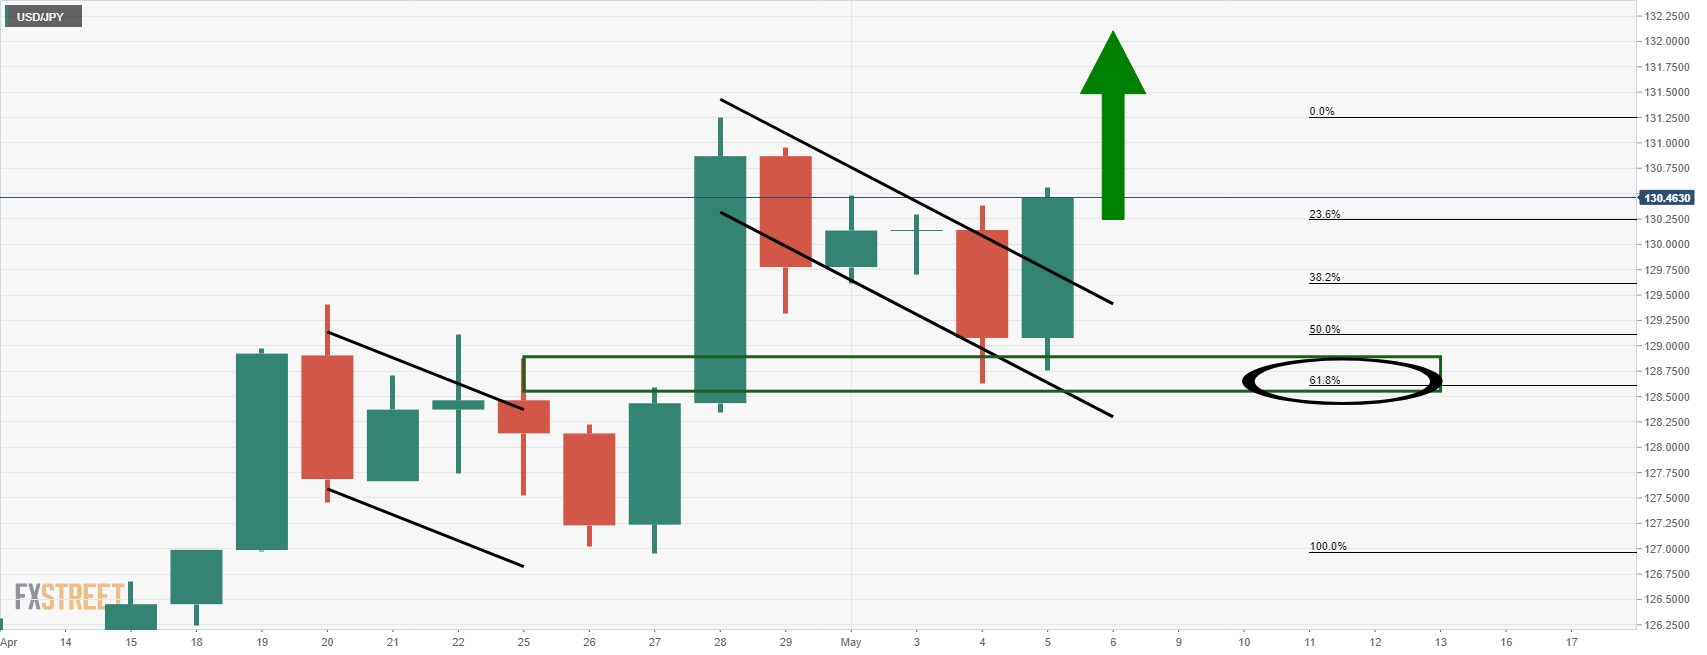
In the current bull flag breakout, we can see that the price corrected to as far as 61.8% Fibonacci ratio and has rallied from prior resistance. This offers conviction to the breakout.
However, the bulls now need to clear hourly resistance:
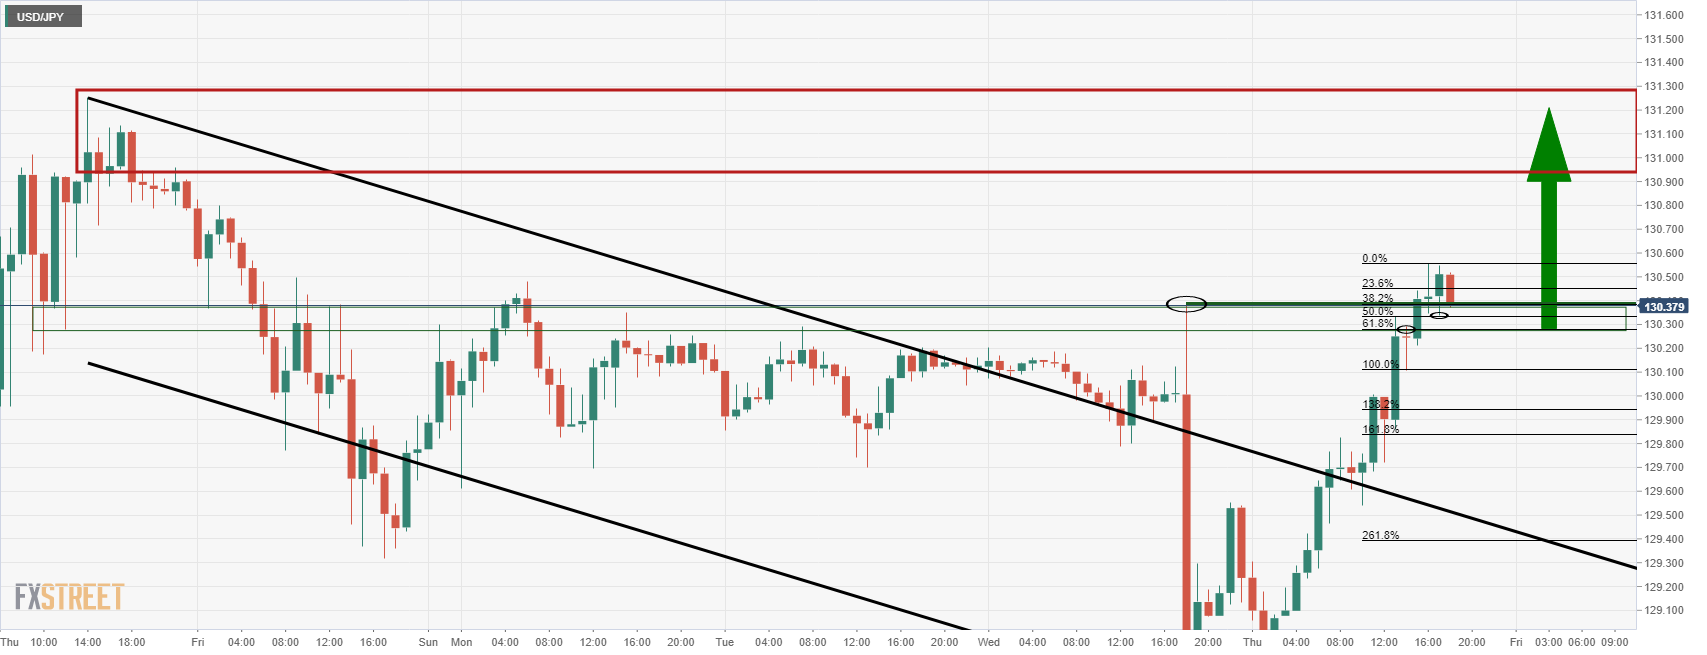
USD/JPY H1 chart
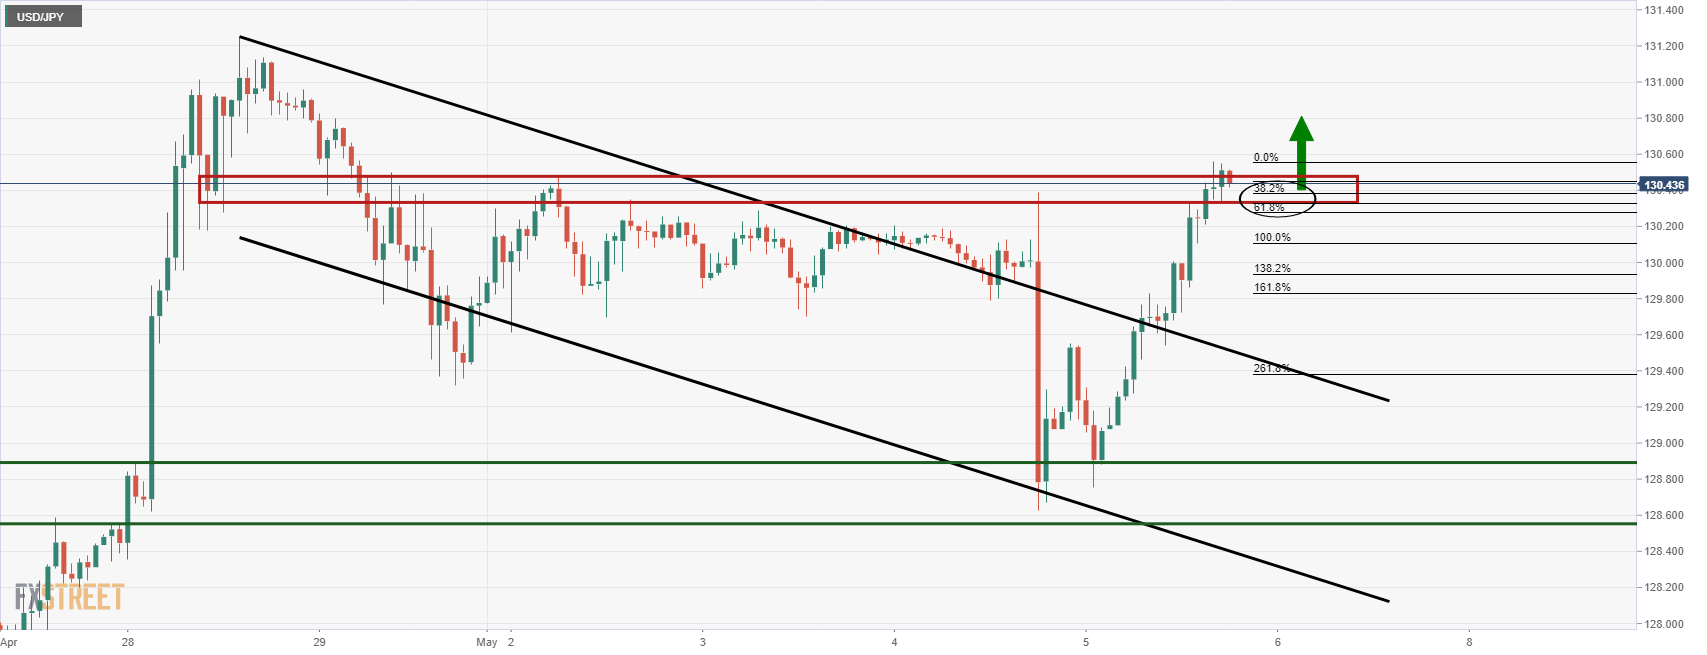
The price is attempting to break clear of the bear's commitments at resistance. The 38.2%, 50% and 61.8% ratios align with the prior resistances on the hourly time frame that could act as support and lead to a surge higher in order to challenge the daily highs for the sessions ahead:
Author

Ross J Burland
FXStreet
Ross J Burland, born in England, UK, is a sportsman at heart. He played Rugby and Judo for his county, Kent and the South East of England Rugby team.


