|

USD/JPY Price Analysis: Bulls are throwing in the towel and H4 bear M-formation is in play

  • USD/JPY's H4 M-formaition is a reversion pattern.
  • Bears need to stay below the neckline for a move to test the recent lows near 140 the figure. 

USD/JPY is crumbling away in Asia as the US dollar folds from the recently scored fresh highs in the monthly bull cycle. The price of the DXY has broken a key structure on the 4-hour charts and this could lead to a significant move to the downside for the week ahead. The following illustrates the market structure and price action on both the DXY and the USD/JPY charts.

DXY chart, H4

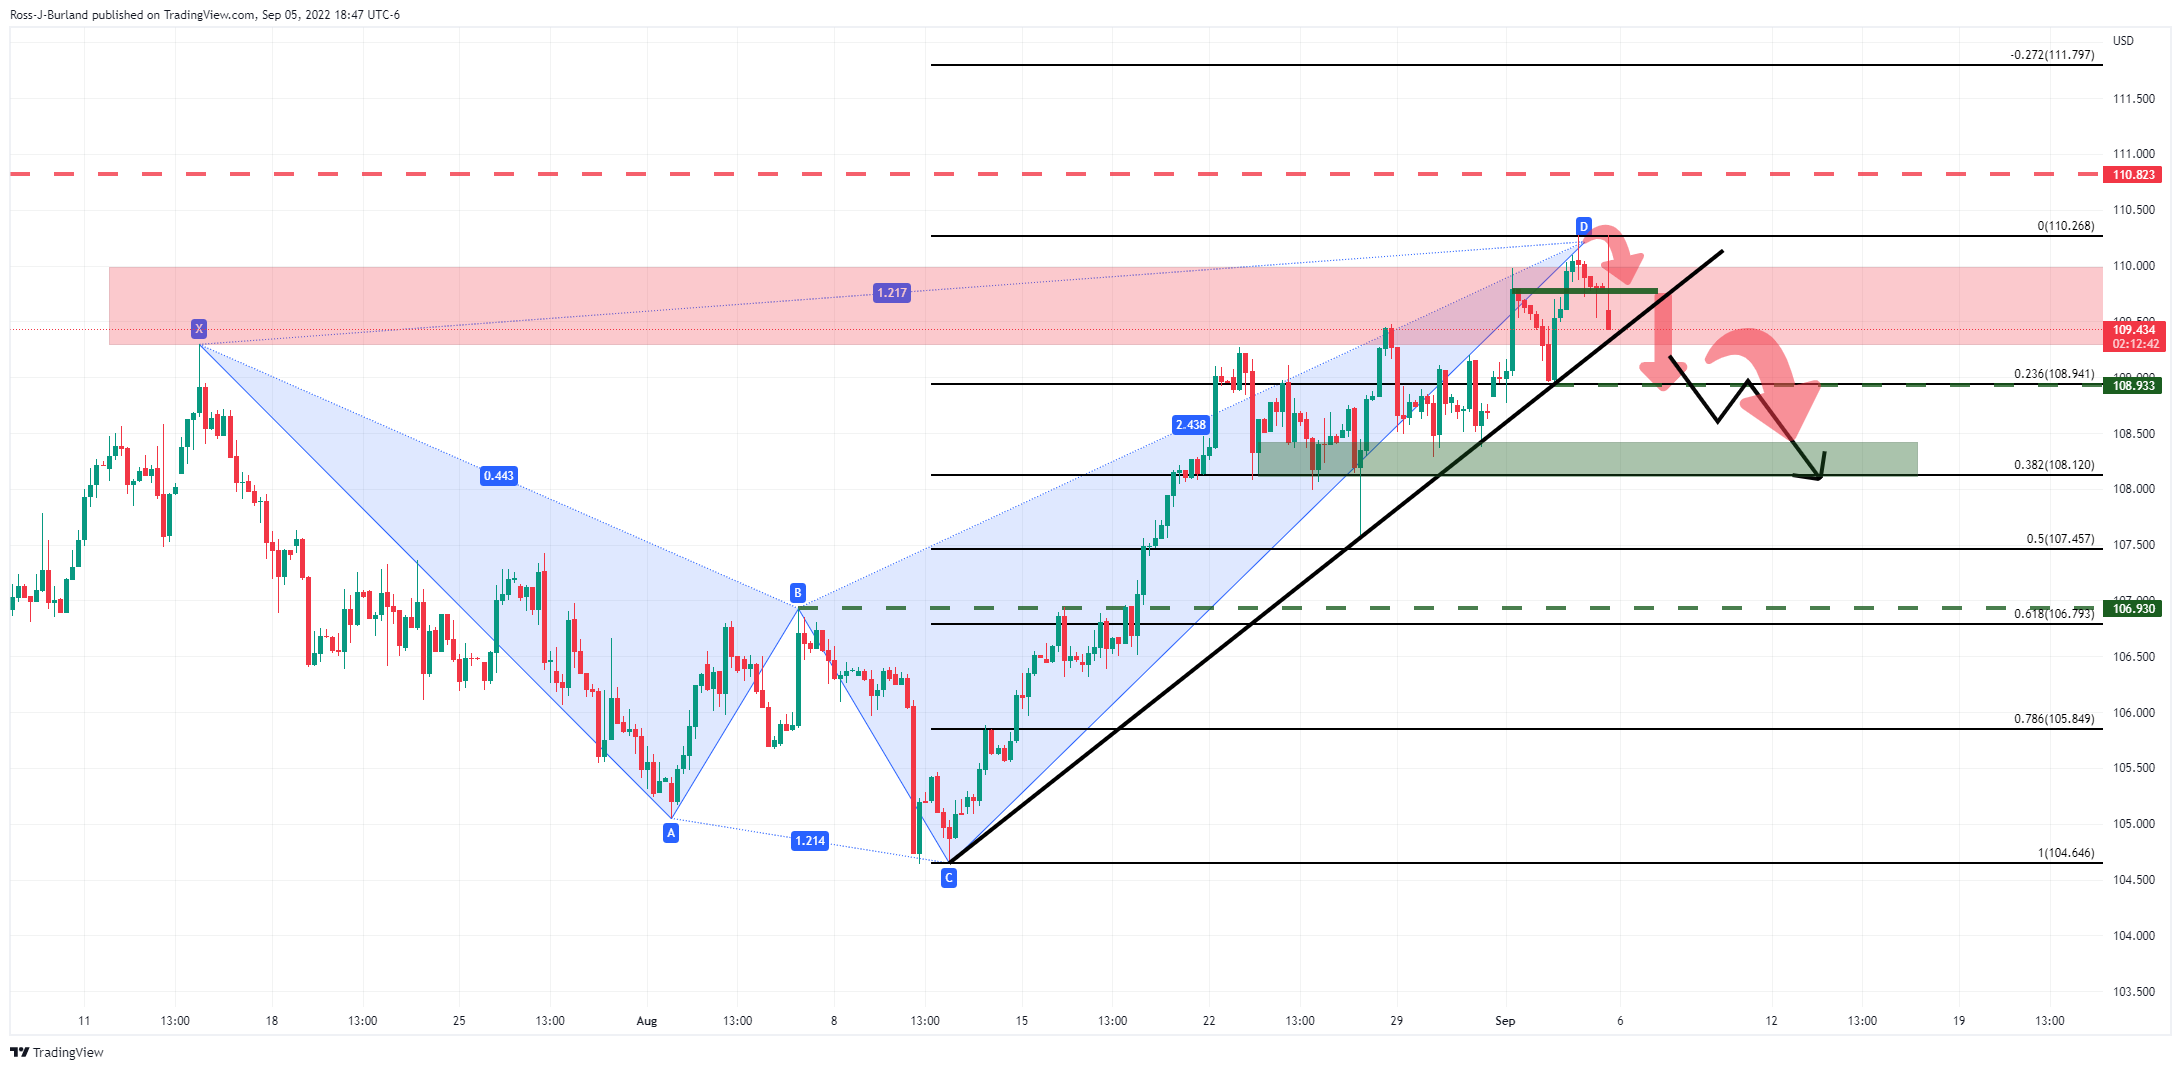
The price broke below the 109.80s and is not headed towards a key area in the 108.90s for the day ahead. If this were to break, it could act as a resistance and if so, then the gates will be open for an even deeper correction where a 38.2% Fibonacci retracement level is located down near 108.12. 

USD/JPY daily chart

The yen is benefitting from the move in the greenback. There is a harmonic pattern that could be about to play out. A peak at this juncture could lead to a significant sell-off towards the prior highs and through the Fibo scale for the days ahead. If this were to hold, however, in the area highlighted above, then there will be prospects of a continuation thereafter. 

USD/JPY H4 chart

The M-formaition is a reversion pattern. The recent bearish impulse will eventually run out of steam and that makes for a move back towards the neckline before further supply that would then tackle the recent lows near 140 the figure. 

Author

Ross J Burland

Ross J Burland, born in England, UK, is a sportsman at heart. He played Rugby and Judo for his county, Kent and the South East of England Rugby team.

More from Ross J Burland
Share:

Editor's Picks

EUR/USD edges lower below 1.1650 as Middle East tensions fuel US Dollar strength

The EUR/USD pair trades in negative territory around 1.1635 during the early Asian session on Thursday. The US Dollar strengthens against the Euro as escalating Middle East conflict boosts safe-haven flows. Traders brace for the Eurozone Retail Sales and US weekly Initial Jobless Claims reports, which will be released later on Thursday. 

GBP/USD tests key moving averages as growth downgrade weighs

GBP/USD was nearly flat on Wednesday, edging up 0.08% to settle around 1.3370 in a quiet session. The pair has fallen sharply from its late-January high near 1.3870 and is now testing the 200-day Exponential Moving Average, with this week's one-week forex heatmap showing Pound Sterling as one of the worst performers against the US Dollar, down about 1.4% on the week.

Gold buyers stay hopeful amid Middle East war, China growth woes

Gold is building on the previous rebound in Thursday’s Asian trades, testing offers once again at the $5,200 threshold. Deeper escalation of the Middle East war and dovish US Federal Reserve monetary policy outlook continue to support Gold.

Trump presses Congress on CLARITY bill after meeting with Coinbase CEO

US President Donald Trump is urging legislators to pass the CLARITY Act after allegedly meeting with Coinbase CEO Brian Armstrong amid growing dispute over stablecoin yields.

First Venezuela, now Iran: The US-China energy war escalates

At first glance, the latest escalation involving the United States with both Iran and Venezuela looks like another chapter in a long-running geopolitical story. But viewed through a broader strategic lens, something else may be unfolding: Energy.

Bittensor extends recovery despite retail demand slump

Bittensor, a leading Artificial Intelligence token, is aging up above $190 at the time of writing on Wednesday. Steady price increases characterise the broader crypto market, with Bitcoin holding above $71,000 and Ethereum above $2,000.