|

USD/JPY Price Analysis: Bullish continuation flag pattern spotted on hourly charts

  • USD/JPY has been retreating along a downward sloping channel on short-term charts.
  • The mentioned channel now constitutes the formation of a bullish flag chart pattern.
  • Mixed oscillators on hourly/daily charts warrant caution before placing aggressive bets.

The USD/JPY pair filled the weekly bearish gap opening, albeit struggled to capitalize on the move and quickly retreated around 20 pips from the 109.00 neighbourhood.

A cautious mood around the equity markets benefitted the safe-haven Japanese yen. Apart from this, sliding US Treasury bond yields held the US dollar bulls from placing aggressive bets and further collaborated to cap the upside for the USD/JPY pair.

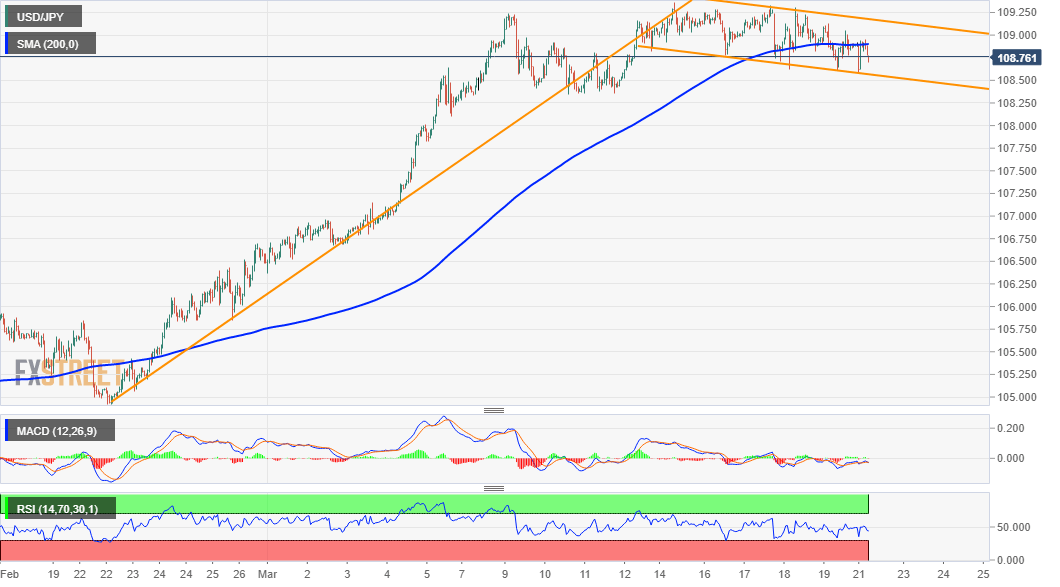
From a technical perspective, the uptick faltered near 200-hour SMA, which should now act as a key pivotal point for short-term traders. That said, the USD/JPY pair, for now, has managed to hold above the lower end of over one-week-old descending channel.

Given the recent strong positive move over the past six weeks or so, the mentioned channel constitutes the formation of a bullish flag pattern. The bullish set-up is reinforced by the fact that oscillators on the daily chart have just eased from overbought conditions.

That said, technical indicators on hourly charts have been drifting lower in the bearish territory and warrant some caution before positioning for any further appreciating move. In the meantime, the 200-hour SMA near the 109.00 mark might continue to cap the upside.

This is followed by the trend-channel resistance, around the 109.15-20 region, which if cleared decisively will be seen as a fresh trigger for bullish traders. This, in turn, will set the stage for a move towards reclaiming the key 110.00 psychological mark.

On the flip side, a sustained break below the trend-channel support, currently near the 108.55-50 region will negate the positive bias and prompt some technical selling. The USD/JPY pair might then correct further towards testing the 108.00 round-figure mark.

USD/JPY 1-hourly chart

fxsoriginal

Technical levels to watch

USD/JPY

Overview
Today last price108.71
Today Daily Change-0.18
Today Daily Change %-0.17
Today daily open108.89
 
Trends
Daily SMA20107.69
Daily SMA50105.81
Daily SMA100104.9
Daily SMA200105.48
 
Levels
Previous Daily High109.13
Previous Daily Low108.61
Previous Weekly High109.37
Previous Weekly Low108.61
Previous Monthly High106.69
Previous Monthly Low104.41
Daily Fibonacci 38.2%108.93
Daily Fibonacci 61.8%108.81
Daily Pivot Point S1108.62
Daily Pivot Point S2108.35
Daily Pivot Point S3108.1
Daily Pivot Point R1109.15
Daily Pivot Point R2109.4
Daily Pivot Point R3109.67

Author

Haresh Menghani

Haresh Menghani is a detail-oriented professional with 10+ years of extensive experience in analysing the global financial markets.

More from Haresh Menghani
Share:

Markets move fast. We move first.

Orange Juice Newsletter brings you expert driven insights - not headlines. Every day on your inbox.

By subscribing you agree to our Terms and conditions.

Editor's Picks

EUR/USD rebounds after falling toward 1.1700

EUR/USD gains traction and trades above 1.1730 in the American session, looking to end the week virtually unchanged. The bullish opening in Wall Street makes it difficult for the US Dollar to preserve its recovery momentum and helps the pair rebound heading into the weekend.

GBP/USD steadies below 1.3400 as traders assess BoE policy outlook

Following Thursday's volatile session, GBP/USD moves sideways below 1.3400 on Friday. Investors reassess the Bank of England's policy oıtlook after the MPC decided to cut the interest rate by 25 bps by a slim margin. Meanwhile, the improving risk mood helps the pair hold its ground.

Gold stays below $4,350, looks to post small weekly gains

Gold struggles to gather recovery momentum and stays below $4,350 in the second half of the day on Friday, as the benchmark 10-year US Treasury bond yield edges higher. Nevertheless, the precious metal remains on track to end the week with modest gains as markets gear up for the holiday season.

Crypto Today: Bitcoin, Ethereum, XRP rebound amid bearish market conditions

Bitcoin (BTC) is edging higher, trading above $88,000 at the time of writing on Monday. Altcoins, including Ethereum (ETH) and Ripple (XRP), are following in BTC’s footsteps, experiencing relief rebounds following a volatile week.

How much can one month of soft inflation change the Fed’s mind?

One month of softer inflation data is rarely enough to shift Federal Reserve policy on its own, but in a market highly sensitive to every data point, even a single reading can reshape expectations. November’s inflation report offered a welcome sign of cooling price pressures. 

XRP rebounds amid ETF inflows and declining retail demand demand

XRP rebounds as bulls target a short-term breakout above $2.00 on Friday. XRP ETFs record the highest inflow since December 8, signaling growing institutional appetite.