USD/JPY Price Analysis: Bears smash weekly support line to aim for further downside below 134.00


  • USD/JPY takes offers to refresh intraday low, snaps six-day uptrend.
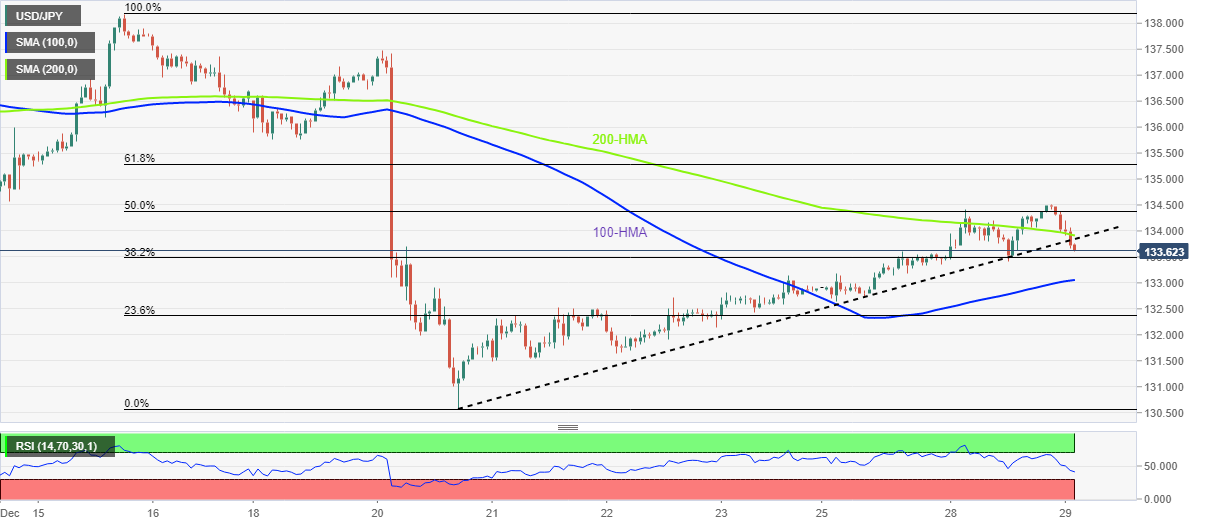
  • Failure to stay beyond 200-HMA joins RSI retreat to break the key support line from December 20.
  • 100-HMA could probe the bears before directing them to the monthly low.
  • Buyers need validation from the recent swing high surrounding 134.50 to retake control.

USD/JPY stands on the slippery ground near 133.65 as it renews its intraday low during the first negative daily performance in seven.

In doing so, the Yen pair breaks the seven-day-old ascending trend line to welcome the bears.

It should be noted that the multiple failures to stay beyond the 200-HMA join the RSI (14) pullback from the overbought territory to allow the USD/JPY pair to remain on the bear’s radar.

However, the 100-HMA support, around 133.00 by the press time, challenges the USD/JPY pair’s immediate downside, a break of which could quickly drag the quote towards the multi-month low marked earlier in December around 130.60-55.

In a case where the USD/JPY pair remains weak past 130.55, the August monthly low near 130.40 and the 130.00 round figure could probe the quote’s further downside.

Alternatively, a convergence of the 200-HMA and the support-turned-resistance line, around 133.95, quickly followed by the 134.00 round figure, guards the USD/JPY pair’s immediate upside.

Following that, the recent top surrounding 134.50 to act as the last defense of USD/JPY bears.

USD/JPY: Hourly chart

Trend: Further downside expected

Additional important levels

Overview
Today last price 133.64
Today Daily Change -0.85
Today Daily Change % -0.63%
Today daily open 134.49
 
Trends
Daily SMA20 135.18
Daily SMA50 140.23
Daily SMA100 141.12
Daily SMA200 136.13
 
Levels
Previous Daily High 134.5
Previous Daily Low 133.36
Previous Weekly High 137.48
Previous Weekly Low 130.57
Previous Monthly High 148.82
Previous Monthly Low 137.5
Daily Fibonacci 38.2% 134.06
Daily Fibonacci 61.8% 133.79
Daily Pivot Point S1 133.73
Daily Pivot Point S2 132.98
Daily Pivot Point S3 132.59
Daily Pivot Point R1 134.87
Daily Pivot Point R2 135.26
Daily Pivot Point R3 136.01


Share: Feed news

Information on these pages contains forward-looking statements that involve risks and uncertainties. Markets and instruments profiled on this page are for informational purposes only and should not in any way come across as a recommendation to buy or sell in these assets. You should do your own thorough research before making any investment decisions. FXStreet does not in any way guarantee that this information is free from mistakes, errors, or material misstatements. It also does not guarantee that this information is of a timely nature. Investing in Open Markets involves a great deal of risk, including the loss of all or a portion of your investment, as well as emotional distress. All risks, losses and costs associated with investing, including total loss of principal, are your responsibility. The views and opinions expressed in this article are those of the authors and do not necessarily reflect the official policy or position of FXStreet nor its advertisers. The author will not be held responsible for information that is found at the end of links posted on this page.

If not otherwise explicitly mentioned in the body of the article, at the time of writing, the author has no position in any stock mentioned in this article and no business relationship with any company mentioned. The author has not received compensation for writing this article, other than from FXStreet.

FXStreet and the author do not provide personalized recommendations. The author makes no representations as to the accuracy, completeness, or suitability of this information. FXStreet and the author will not be liable for any errors, omissions or any losses, injuries or damages arising from this information and its display or use. Errors and omissions excepted.

The author and FXStreet are not registered investment advisors and nothing in this article is intended to be investment advice.

Recommended content


Recommended content

Editors’ Picks

EUR/USD regains traction, recovers above 1.0700

EUR/USD regains traction, recovers above 1.0700

EUR/USD regained its traction and turned positive on the day above 1.0700 in the American session. The US Dollar struggles to preserve its strength after the data from the US showed that the economy grew at a softer pace than expected in Q1.

EUR/USD News

GBP/USD returns to 1.2500 area in volatile session

GBP/USD returns to 1.2500 area in volatile session

GBP/USD reversed its direction and recovered to 1.2500 after falling to the 1.2450 area earlier in the day. Although markets remain risk-averse, the US Dollar struggles to find demand following the disappointing GDP data.

GBP/USD News

Gold climbs above $2,340 following earlier drop

Gold climbs above $2,340 following earlier drop

Gold fell below $2,320 in the early American session as US yields shot higher after the data showed a significant increase in the US GDP price deflator in Q1. With safe-haven flows dominating the markets, however, XAU/USD reversed its direction and rose above $2,340.

Gold News

XRP extends its decline, crypto experts comment on Ripple stablecoin and benefits for XRP Ledger

XRP extends its decline, crypto experts comment on Ripple stablecoin and benefits for XRP Ledger

Ripple extends decline to $0.52 on Thursday, wipes out weekly gains. Crypto expert asks Ripple CTO how the stablecoin will benefit the XRP Ledger and native token XRP. 

Read more

After the US close, it’s the Tokyo CPI

After the US close, it’s the Tokyo CPI

After the US close, it’s the Tokyo CPI, a reliable indicator of the national number and then the BoJ policy announcement. Tokyo CPI ex food and energy in Japan was a rise to 2.90% in March from 2.50%.

Read more

Forex MAJORS

Cryptocurrencies

Signatures