|

USD/JPY Price Analysis: Bears occupy driver’s seat despite snapping four-day downtrend near 139.00

  • USD/JPY clings to mild gains during the first positive day in five.
  • Sustained downside break of previous key support, bearish trend channel keeps Yen pair sellers hopeful.
  • 100-HMA acts as the last defense of Yen sellers, bumpy road awaits pair sellers on US NFP day.

USD/JPY struggles to defend the first daily gains in five as it seesaws around 139.00 heading into Friday’s European session, mildly bid near 138.85 by the press time.

The Yen pair’s latest corrective bounce could be linked to the RSI (14) line’s gradual rebound from the oversold territory, as well as the quote’s inability to break the lower line of a bearish channel stretched from Tuesday. The recovery moves also justify the bullish MACD signals.

However, a one-week-old previous support line, close to 139.15 at the latest, restricts the USD/JPY pair’s immediate upside within a short-term bearish channel, currently between 138.35 and 139.50.

Even if the Yen pair manages to deft the immediate bearish chart formation, the 100-Hour Moving Average (HMA) near 139.70, quickly followed by the 140.00 round figure, could challenge the bulls before giving them control.

On the flip side, a clear break of 138.35 will also reject the previously stated bearish channel but in favor of the USD/JPY sellers. Following that, the quote could drop to the May 19 swing low of around 137.40.

It’s worth noting that the 50% and 61.8% Fibonacci retracement level of the pair’s moves between May 11 and 30, around 137.30 and 136.50, could challenge the bears afterward.

Apart from the aforementioned technical details, the Yen pair’s risk-barometer status also justifies the pair’s latest inaction as the markets await the US employment report.

Also read: Forex Today: US Dollar struggles to find demand, all eyes on NFP

USD/JPY: Hourly chart
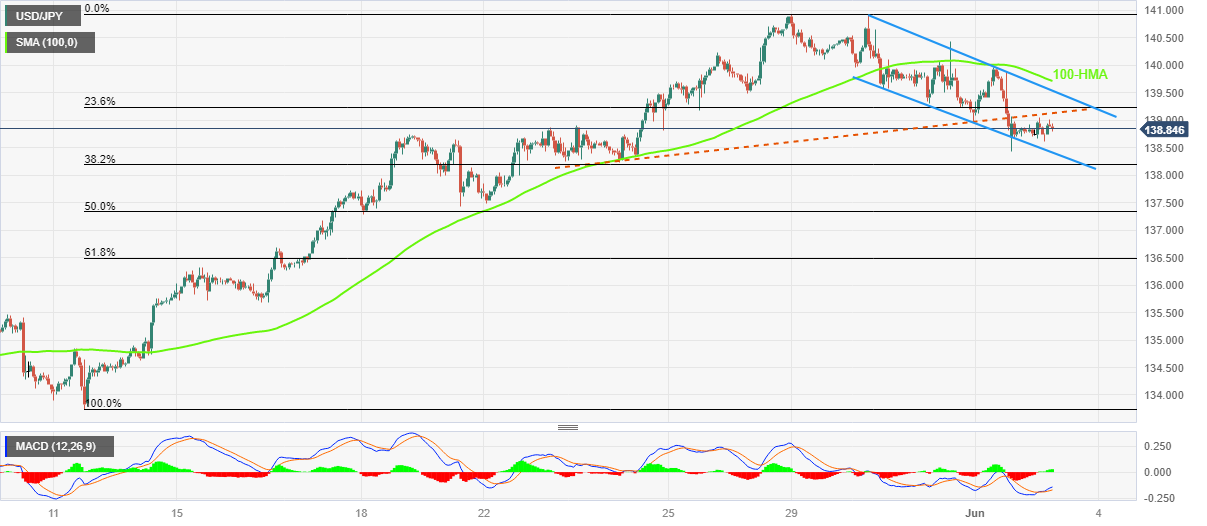
Trend: Bearish

Additional important levels

Overview
Today last price138.92
Today Daily Change0.13
Today Daily Change %0.09%
Today daily open138.79
 
Trends
Daily SMA20137.61
Daily SMA50135.13
Daily SMA100133.84
Daily SMA200137.28
 
Levels
Previous Daily High139.95
Previous Daily Low138.43
Previous Weekly High140.72
Previous Weekly Low137.49
Previous Monthly High140.93
Previous Monthly Low133.5
Daily Fibonacci 38.2%139.01
Daily Fibonacci 61.8%139.37
Daily Pivot Point S1138.16
Daily Pivot Point S2137.54
Daily Pivot Point S3136.64
Daily Pivot Point R1139.69
Daily Pivot Point R2140.58
Daily Pivot Point R3141.21

Author

Anil Panchal

Anil Panchal

FXStreet

Anil Panchal has nearly 15 years of experience in tracking financial markets. With a keen interest in macroeconomics, Anil aptly tracks global news/updates and stays well-informed about the global financial moves and their implications.

More from Anil Panchal
Share:

Markets move fast. We move first.

Orange Juice Newsletter brings you expert driven insights - not headlines. Every day on your inbox.

By subscribing you agree to our Terms and conditions.

Editor's Picks

EUR/USD moves sideways below 1.1800 on Christmas Eve

EUR/USD struggles to find direction and trades in a narrow channel below 1.1800 after posting gains for two consecutive days. Bond and stock markets in the US will open at the usual time and close early on Christmas Eve, allowing the trading action to remain subdued. 

GBP/USD keeps range around 1.3500 amid quiet markets

GBP/USD keeps its range trade intact at around 1.3500 on Wednesday. The Pound Sterling holds the upper hand over the US Dollar amid pre-Christmas light trading as traders move to the sidelines heading into the holiday season. 

Gold retreats from record highs, trades below $4,500

Gold retreats after setting a new record-high above $4,520 earlier in the day and trades in a tight range below $4,500 as trading volumes thin out ahead of the Christmas break. The US Dollar selling bias remains unabated on the back of dovish Fed expectations, which continues to act as a tailwind for the bullion amid persistent geopolitical risks.

Bitcoin slips below $87,000 as ETF outflows intensify, whale participation declines

Bitcoin price continues to trade around $86,770 on Wednesday, after failing to break above the $90,000 resistance. US-listed spot ETFs record an outflow of $188.64 million on Tuesday, marking the fourth consecutive day of withdrawals.

Economic outlook 2026-2027 in advanced countries: Solidity test

After a year marked by global economic resilience and ending on a note of optimism, 2026 looks promising and could be a year of solid economic performance. In our baseline scenario, we expect most of the supportive factors at work in 2025 to continue to play a role in 2026.

Avalanche struggles near $12 as Grayscale files updated form for ETF

Avalanche trades close to $12 by press time on Wednesday, extending the nearly 2% drop from the previous day. Grayscale filed an updated form to convert its Avalanche-focused Trust into an ETF with the US Securities and Exchange Commission.