|

USD/JPY Price Analysis: Bears gather momentum on BoJ’s news, threatening to crack the 20-DMA

  • The USD/JPY 1-hour chart falling wedge was invalidated by a price violation on BoJ’s Ueda news.
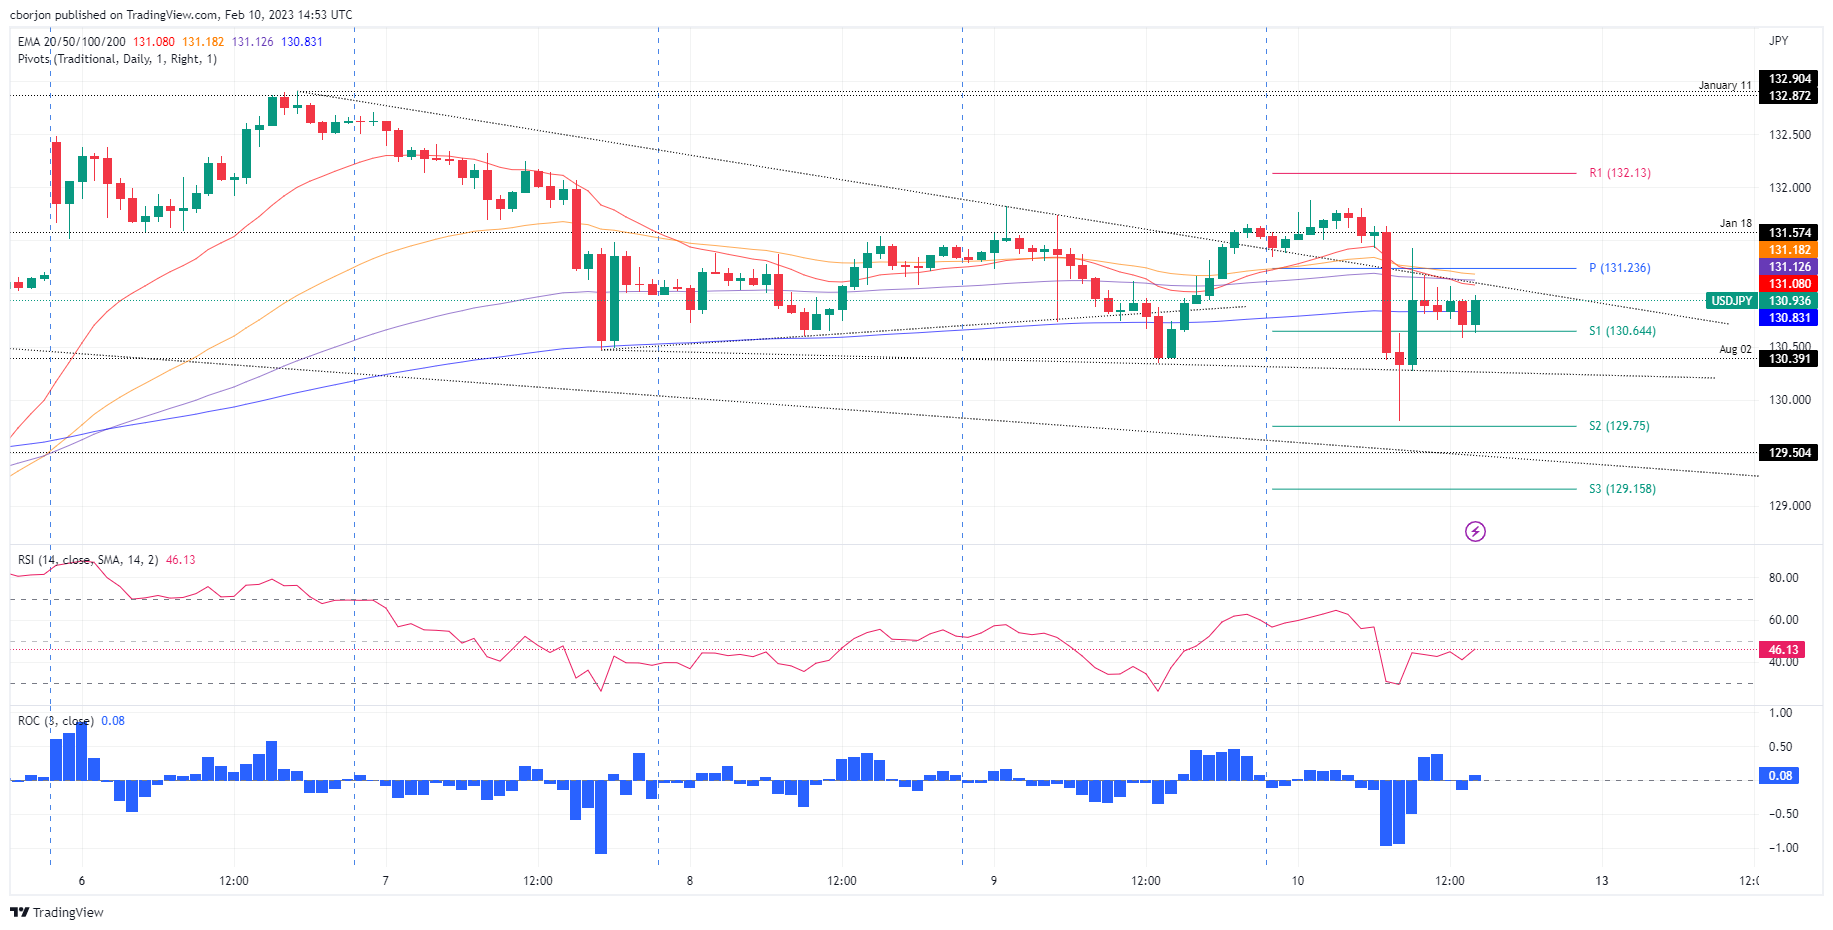
  • USD/JPY Price Analysis: Long-term is still downward biased unless it breaks resistance around 133.00.

USD/JPY remains pressured by rumors that Kazuo Ueda will be appointed as the new Bank of Japan (BoJ) Governor, sending the USD/JPY diving to its weekly low of 129.79. Nevertheless, the USD/JPY recovered some ground, exchanging hands at around 130.90, slightly above the 20-day Exponential Moving Average (EMA).

From a daily chart perspective, the USD/JPY remains downward biased, but buyers reclaiming the 20-day EMA at 130.72 could put into play the psychological 131.00 level. The Relative Strength Index (RSI) suggests that a bearish continuation is likely, while the Rate of Change (RoC) shifted neutral.

Intraday, the USD/JPY one-hour chart portrays the pair as downward biased. On Thursday’s analysis, I wrote, “the formation of a falling wedge, suggesting a bullish continuation, which could lift prices towards 131.60 and the January 11 high at 132.87,” and added mixed signals between the RSI and the RoC, suggesting that caution is warranted. Hence, BoJ’s news invalidated the chart pattern and opened the door for further losses.

For USD/JPY to resume its upward bias, it must clear the day’s high at 131.87, followed by the weekly high at 132.90. On the other hand, and in the most probable scenario, the USD/JPY could retest the week’s low. Therefore, the USD/JPY first support would be the S1 daily pivot at 130.64. A breach of the latter will expose the psychological 130.000 level, followed by the lows of the week/session at 129.79.

USD/JPY One-hour chart

USD/JPY key technical levels

USD/JPY

Overview
Today last price130.94
Today Daily Change-0.68
Today Daily Change %-0.52
Today daily open131.62
 
Trends
Daily SMA20129.91
Daily SMA50132.33
Daily SMA100138.32
Daily SMA200136.82
 
Levels
Previous Daily High131.83
Previous Daily Low130.34
Previous Weekly High131.2
Previous Weekly Low128.08
Previous Monthly High134.78
Previous Monthly Low127.22
Daily Fibonacci 38.2%131.26
Daily Fibonacci 61.8%130.91
Daily Pivot Point S1130.7
Daily Pivot Point S2129.78
Daily Pivot Point S3129.21
Daily Pivot Point R1132.18
Daily Pivot Point R2132.75
Daily Pivot Point R3133.67

Author

Christian Borjon Valencia

Christian Borjon began his career as a retail trader in 2010, mainly focused on technical analysis and strategies around it. He started as a swing trader, as he used to work in another industry unrelated to the financial markets.

More from Christian Borjon Valencia
Share:

Markets move fast. We move first.

Orange Juice Newsletter brings you expert driven insights - not headlines. Every day on your inbox.

By subscribing you agree to our Terms and conditions.

Editor's Picks

EUR/USD moves sideways below 1.1800 on Christmas Eve

EUR/USD struggles to find direction and trades in a narrow channel below 1.1800 after posting gains for two consecutive days. Bond and stock markets in the US will open at the usual time and close early on Christmas Eve, allowing the trading action to remain subdued. 

GBP/USD keeps range around 1.3500 amid quiet markets

GBP/USD keeps its range trade intact at around 1.3500 on Wednesday. The Pound Sterling holds the upper hand over the US Dollar amid pre-Christmas light trading as traders move to the sidelines heading into the holiday season. 

Gold retreats from record highs, trades below $4,500

Gold retreats after setting a new record-high above $4,520 earlier in the day and trades in a tight range below $4,500 as trading volumes thin out ahead of the Christmas break. The US Dollar selling bias remains unabated on the back of dovish Fed expectations, which continues to act as a tailwind for the bullion amid persistent geopolitical risks.

Bitcoin slips below $87,000 as ETF outflows intensify, whale participation declines

Bitcoin price continues to trade around $86,770 on Wednesday, after failing to break above the $90,000 resistance. US-listed spot ETFs record an outflow of $188.64 million on Tuesday, marking the fourth consecutive day of withdrawals.

Economic outlook 2026-2027 in advanced countries: Solidity test

After a year marked by global economic resilience and ending on a note of optimism, 2026 looks promising and could be a year of solid economic performance. In our baseline scenario, we expect most of the supportive factors at work in 2025 to continue to play a role in 2026.

Avalanche struggles near $12 as Grayscale files updated form for ETF

Avalanche trades close to $12 by press time on Wednesday, extending the nearly 2% drop from the previous day. Grayscale filed an updated form to convert its Avalanche-focused Trust into an ETF with the US Securities and Exchange Commission.