|

USD/JPY Price Analysis: Bears flex muscles with eyes on 130.60

  • USD/JPY retreats from one-week high to snap three-day uptrend.
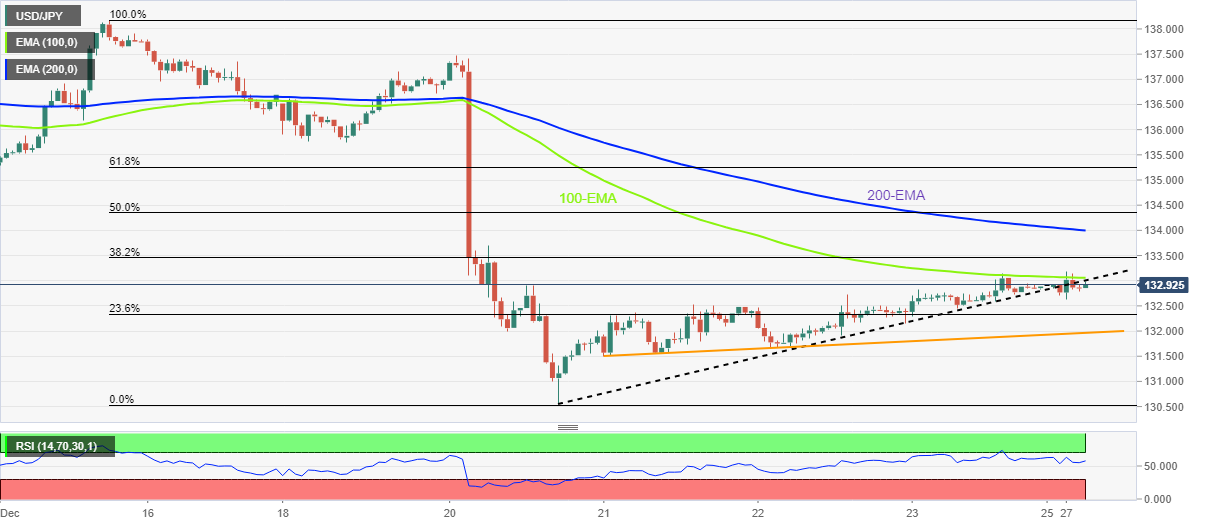
  • Downside break of weekly support line adds strength to bearish bias.
  • 100, 200 EMAs add to the upside filters.

USD/JPY remains depressed around 132.90 as it prints the first daily loss in four during early Tuesday morning in Europe. In doing so, the Yen pair justifies the downside break of a one-wee-old ascending trend line, as well as a U-turn from the 100-hour Exponential Moving Average (EMA).

The pullback move also takes clues from the RSI (14) retreat, as well as an absence of the oversold RSI line.

That said, the USD/JPY price aim for the 23.6% Fibonacci retracement level of December 15-20 downside, near 132.30.

Following that, an upward-sloping support line from the last Wednesday, near the 132.00 round figure could test the USD/JPY bears before directing them to the recently flashed multi-month low near 130.60.

In a case where the USD/JPY pair drops below 130.60, the August 2022 low near 130.40 and the 130.00 psychological magnet could act as the last defense of the buyers.

Alternatively, the support-turned-resistance line and the 100-EMA, respectively around 132.95 and 133.05, could restrict immediate USD/JPY recovery before highlighting the 200-EMA level of 134.00.

Should the USD/JPY bulls keep the reins past 134.00, the December 19 swing low near 135.80 will gain the market’s attention.

It should be noted that the 50% and 61.8% Fibonacci retracement levels, respectively near 134.35 and 135.25, could probe the USD/JPY bulls during the expected rise.

USD/JPY: Hourly chart

Trend: Further downside expected

additional important levels

Overview
Today last price132.85
Today Daily Change-0.07
Today Daily Change %-0.05%
Today daily open132.92
 
Trends
Daily SMA20135.62
Daily SMA50140.86
Daily SMA100141.12
Daily SMA200136
 
Levels
Previous Daily High132.92
Previous Daily Low132.92
Previous Weekly High137.48
Previous Weekly Low130.57
Previous Monthly High148.82
Previous Monthly Low137.5
Daily Fibonacci 38.2%132.92
Daily Fibonacci 61.8%132.92
Daily Pivot Point S1132.92
Daily Pivot Point S2132.92
Daily Pivot Point S3132.92
Daily Pivot Point R1132.92
Daily Pivot Point R2132.92
Daily Pivot Point R3132.92

Author

Anil Panchal

Anil Panchal

FXStreet

Anil Panchal has nearly 15 years of experience in tracking financial markets. With a keen interest in macroeconomics, Anil aptly tracks global news/updates and stays well-informed about the global financial moves and their implications.

More from Anil Panchal
Share:

Markets move fast. We move first.

Orange Juice Newsletter brings you expert driven insights - not headlines. Every day on your inbox.

By subscribing you agree to our Terms and conditions.

Editor's Picks

EUR/USD holds near 1.1800 after pulling back from three-month highs

EUR/USD holds gains for the third successive session, trading around 1.1790 during the Asian hours on Wednesday. On the daily chart, technical analysis indicates a persistent bullish bias, as the pair moves upward within the ascending channel pattern. Additionally, the 14-day Relative Strength Index stands at 71 (overbought), which could temper immediate upside as momentum stretches. An RSI overbought status would favor consolidation phases before trend resumption.

GBP/USD gathers strength above 1.3500 as BoE signals gradual easing

The GBP/USD pair trades in positive territory near 1.3510 during the early European session on Wednesday. The Pound Sterling strengthens against the Greenback on expectations that the Bank of England will follow a gradual monetary easing path in 2026.  

Gold: Record rally sustains near $4,500 on safe-haven flows

Gold sustains the record-setting rally near $4,500 in the Asian session on Wednesday. The Israel-Iran conflict and the escalating US-Venezuela tensions boost safe-haven flows into Gold. Furthermore, US Q3 GDP data fails to lift the US Dollar amid growing bets for two Fed rate cuts in 2026, underpinning the non-yielding bullion. 

Bitcoin, Ethereum and Ripple face downside risks as breakout attempts falter

Bitcoin, Ethereum and Ripple continue to trade in red on Wednesday as recent breakout attempts lose momentum near key resistance levels. BTC failed to reclaim the $90,000, ETH slipped below $3,000, while XRP faced rejection near $1.96.

Ten questions that matter going into 2026

2026 may be less about a neat “base case” and more about a regime shift—the market can reprice what matters most (growth, inflation, fiscal, geopolitics, concentration). The biggest trap is false comfort: the same trades can look defensive… right up until they become crowded.

Dogecoin ticks lower as low Open Interest, funding rate weigh on buyers

Dogecoin extends its decline as risk-off sentiment dominates across the crypto market. DOGE’s derivatives market remains weak amid suppressed futures Open Interest and perpetual funding rate.