USD/JPY Price Analysis: Bears are lurking within a strong bullish trend
- USD/JPY's daily chart's higher Fibonaccis remain vulnerable.
- USDJPY's four-hour chart has left behind a W-formation.

USD/JPY bulls remain in charge but there are prospects of a pullback for the coming sessions and days ahead. The following illustrates the market structure on the daily and 4-hour time frames.
USD/JPY daily chart
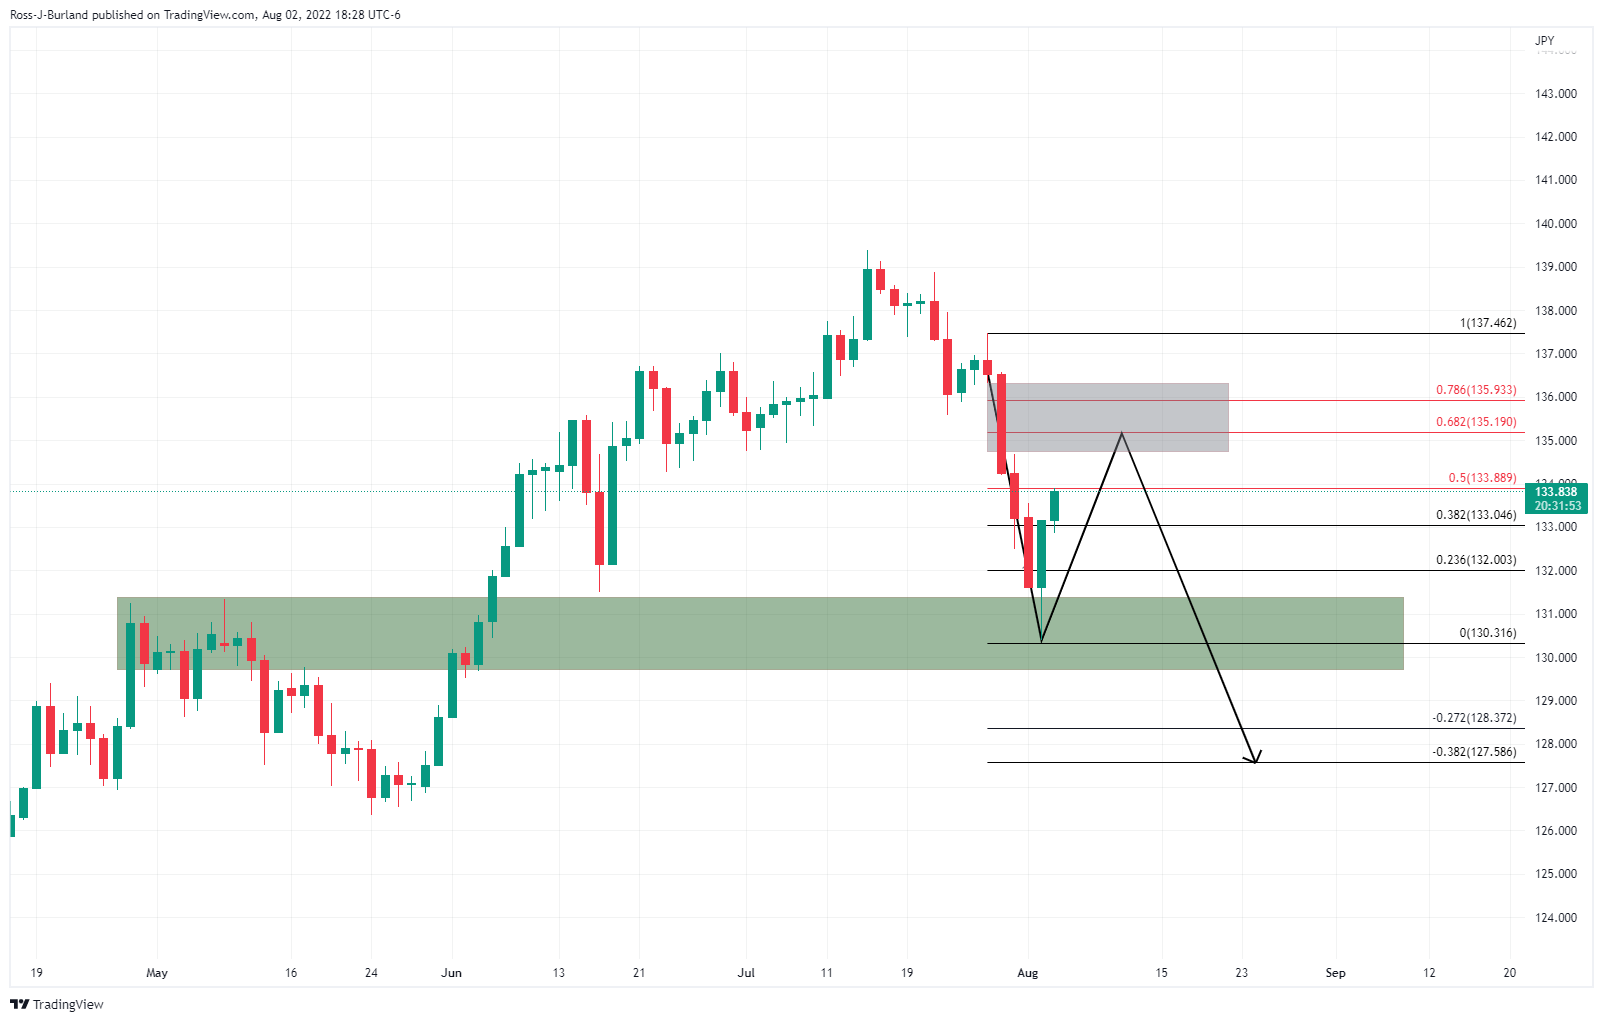
The price of USD/JPY has corrected from the lower quarter of the 130 area in a determined two-day rally to a 50% mean reversion of the prior bearish impulse. From here, should the bulls commit, the price could be attracted to a higher volume area on the chart where there is a price imbalance aligning with the 61.8% and 78.6% Fibonacci levels.
USD/JPY H4 chart
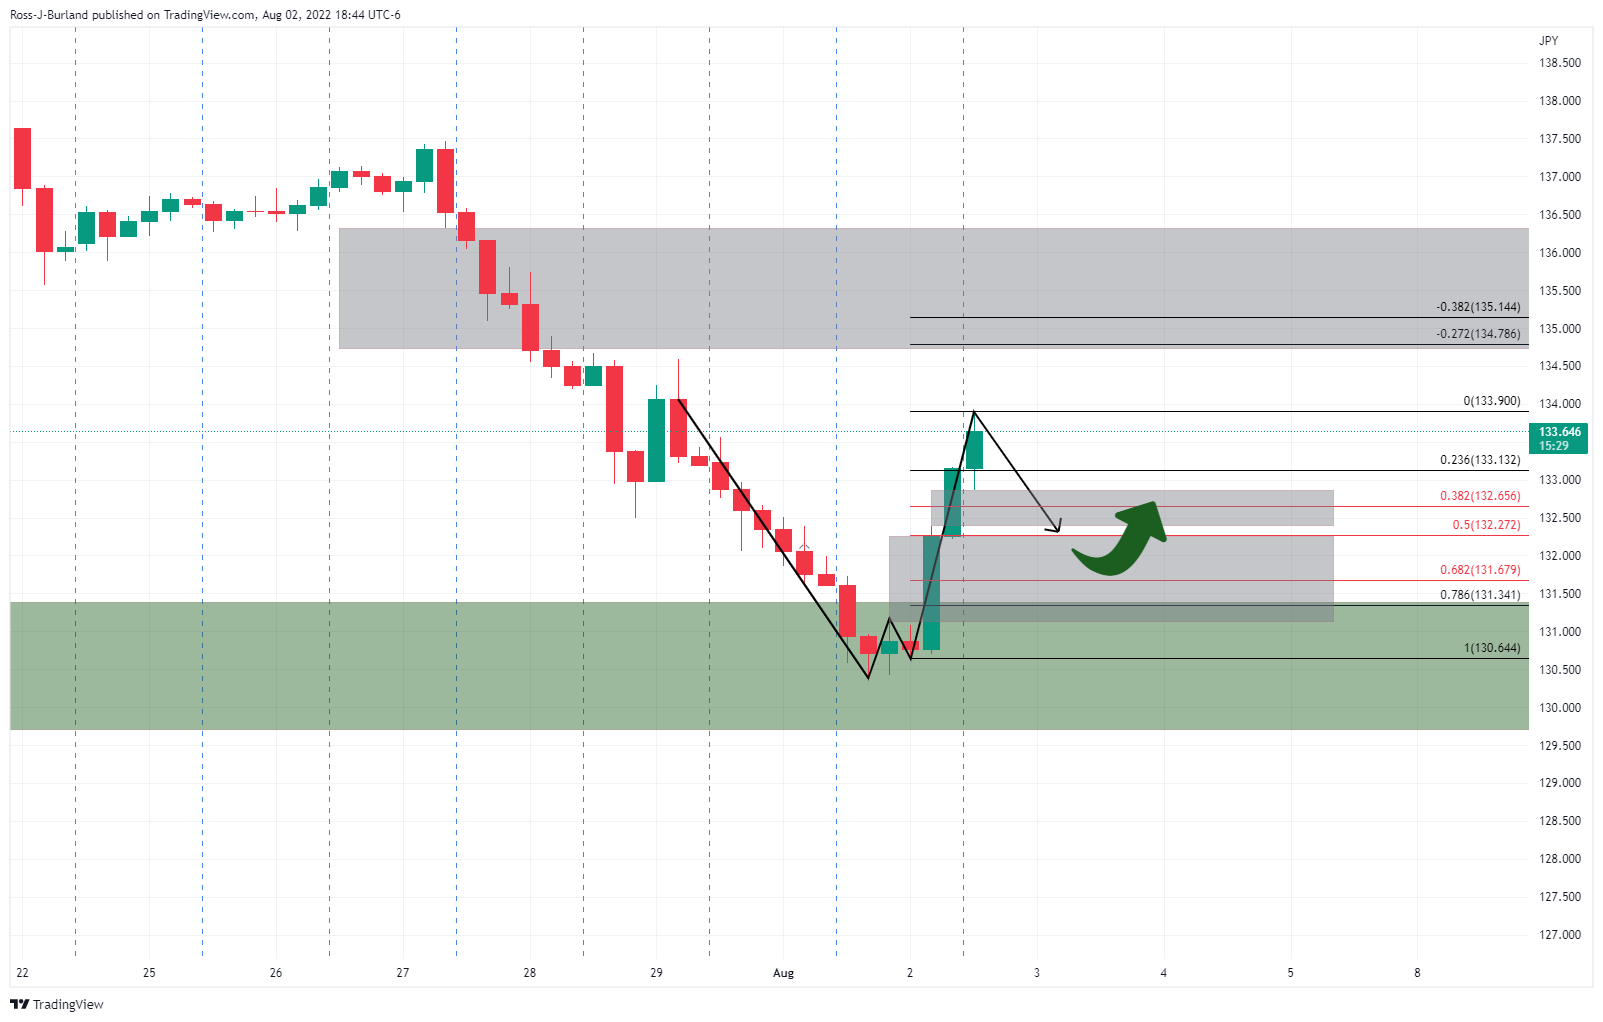
However, USDJPY's four-hour chart has left behind a W-formation following the recent bullish correction. This is a reversion pattern that would be expected to see a pullback in due course. There are a couple of areas of price imbalances below the current spot. A 50% mean reversion idles between these areas which could be a compelling area of interest near 132.30.
Author

Ross J Burland
FXStreet
Ross J Burland, born in England, UK, is a sportsman at heart. He played Rugby and Judo for his county, Kent and the South East of England Rugby team.


