USD/JPY Price Analysis: Bears approach 138.40 key support


  • USD/JPY takes offers to refresh weekly low, prints three-day downtrend.
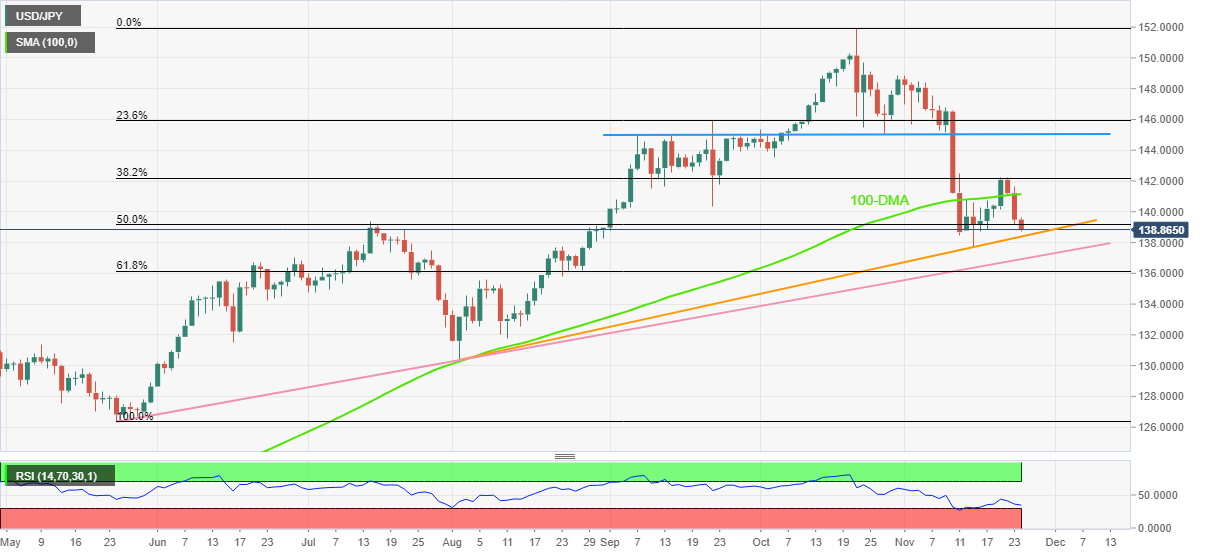
  • Ascending trend line from August lures sellers but RSI conditions challenge further downside past 138.40.
  • 100-DMA, recent swing high guard recovery moves, October’s low holds the key for buyer’s entry.

USD/JPY stands on the slippery ground as it renews its weekly low near 138.80 during early Thursday. In doing so, the Japanese Yen (JPY) pair drops for the third consecutive day after reversing from the 38.2% Fibonacci retracement level of the May-October upside.

In addition to the U-turn from an important Fibonacci hurdle, a clear downside break of the 100-DMA and bearish MACD signals also favor USD/JPY bears.

However, an upward-sloping trend line from early August, around 138.40 by the press time, could restrict the Yen pair’s further downside amid a nearly oversold RSI (14) line.

Even if the quote breaks the 138.40 support, a six-month-old ascending support line, close to 136.90 at the latest, will act as an additional downside filter to challenge USD/JPY sellers.

It’s worth observing that the 61.8% Fibonacci retracement level near 136.10, also known as the golden ratio, will act as the last defense of the USD/JPY bulls.

On the contrary, the 100-DMA and the aforementioned 38.2% Fibonacci retracement level, respectively near 141.15 and 142.20, could restrict the short-term upside of the pair.

However, a horizontal area comprising multiple levels marked since early September, close to 145.10, will be a tough nut to crack for the USD/JPY bulls.

USD/JPY: Daily chart

Trend: Further downside expected

additional important levels

Overview
Today last price 138.87
Today Daily Change -0.62
Today Daily Change % -0.44%
Today daily open 139.49
 
Trends
Daily SMA20 143.68
Daily SMA50 144.94
Daily SMA100 141.12
Daily SMA200 133.72
 
Levels
Previous Daily High 141.61
Previous Daily Low 139.17
Previous Weekly High 140.8
Previous Weekly Low 137.67
Previous Monthly High 151.94
Previous Monthly Low 143.53
Daily Fibonacci 38.2% 140.1
Daily Fibonacci 61.8% 140.68
Daily Pivot Point S1 138.57
Daily Pivot Point S2 137.64
Daily Pivot Point S3 136.12
Daily Pivot Point R1 141.01
Daily Pivot Point R2 142.54
Daily Pivot Point R3 143.46


Share: Feed news

Information on these pages contains forward-looking statements that involve risks and uncertainties. Markets and instruments profiled on this page are for informational purposes only and should not in any way come across as a recommendation to buy or sell in these assets. You should do your own thorough research before making any investment decisions. FXStreet does not in any way guarantee that this information is free from mistakes, errors, or material misstatements. It also does not guarantee that this information is of a timely nature. Investing in Open Markets involves a great deal of risk, including the loss of all or a portion of your investment, as well as emotional distress. All risks, losses and costs associated with investing, including total loss of principal, are your responsibility. The views and opinions expressed in this article are those of the authors and do not necessarily reflect the official policy or position of FXStreet nor its advertisers. The author will not be held responsible for information that is found at the end of links posted on this page.

If not otherwise explicitly mentioned in the body of the article, at the time of writing, the author has no position in any stock mentioned in this article and no business relationship with any company mentioned. The author has not received compensation for writing this article, other than from FXStreet.

FXStreet and the author do not provide personalized recommendations. The author makes no representations as to the accuracy, completeness, or suitability of this information. FXStreet and the author will not be liable for any errors, omissions or any losses, injuries or damages arising from this information and its display or use. Errors and omissions excepted.

The author and FXStreet are not registered investment advisors and nothing in this article is intended to be investment advice.

Recommended content


Recommended content

Editors’ Picks

AUD/USD risks a deeper drop in the short term

AUD/USD risks a deeper drop in the short term

AUD/USD rapidly left behind Wednesday’s decent advance and resumed its downward trend on the back of the intense buying pressure in the greenback, while mixed results from the domestic labour market report failed to lend support to AUD.

AUD/USD News

EUR/USD leaves the door open to a decline to 1.0600

EUR/USD leaves the door open to a decline to 1.0600

A decent comeback in the Greenback lured sellers back into the market, motivating EUR/USD to give away the earlier advance to weekly tops around 1.0690 and shift its attention to a potential revisit of the 1.0600 neighbourhood instead.

EUR/USD News

Gold is closely monitoring geopolitics

Gold is closely monitoring geopolitics

Gold trades in positive territory above $2,380 on Thursday. Although the benchmark 10-year US Treasury bond yield holds steady following upbeat US data, XAU/USD continues to stretch higher on growing fears over a deepening conflict in the Middle East.

Gold News

Bitcoin price shows strength as IMF attests to spread and intensity of BTC transactions ahead of halving

Bitcoin price shows strength as IMF attests to spread and intensity of BTC transactions ahead of halving

Bitcoin (BTC) price is borderline strong and weak with the brunt of the weakness being felt by altcoins. Regarding strength, it continues to close above the $60,000 threshold for seven weeks in a row.

Read more

Is the Biden administration trying to destroy the Dollar?

Is the Biden administration trying to destroy the Dollar?

Confidence in Western financial markets has already been shaken enough by the 20% devaluation of the dollar over the last few years. But now the European Commission wants to hand Ukraine $300 billion seized from Russia.

Read more

Forex MAJORS

Cryptocurrencies

Signatures