USD/JPY Price Analysis: Bearish around mid-138.00s inside fortnight-old triangle
- USD/JPY takes offers to refresh intraday low inside a two-week-long symmetrical triangle.
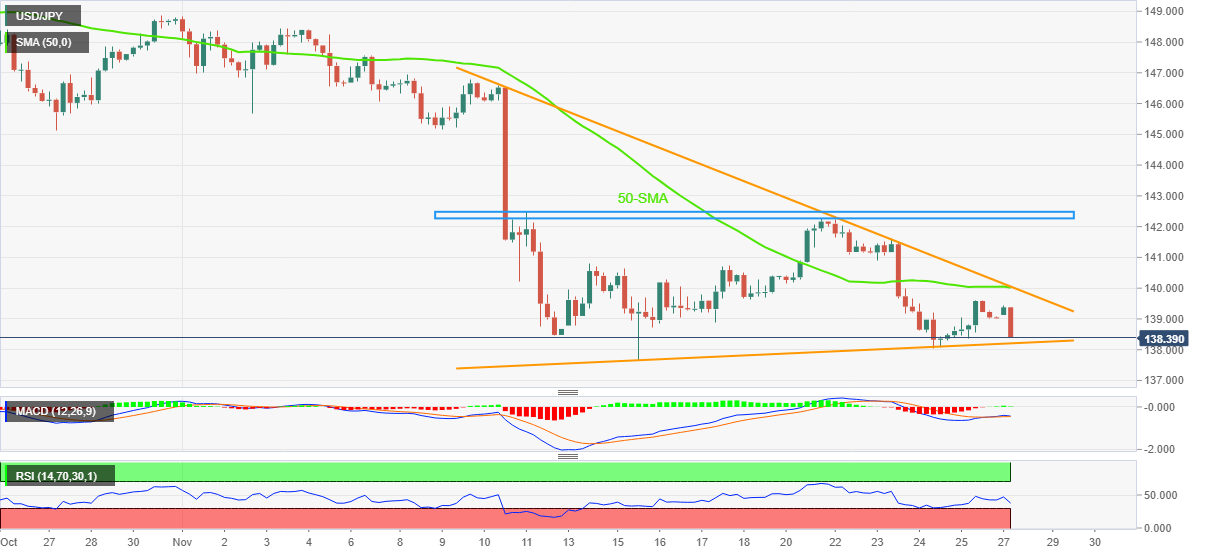
- Sluggish MACD challenges further downside, 50-SMA adds strength to the triangle’s resistance line.
- Bulls remain unconvinced below 142.50, sellers could aim for 135.80-60 zone on defying triangle formation.

USD/JPY stands on slippery grounds near 138.50 as risk-aversion intensifies during early Monday. Even so, the Yen pair remains inside a 12-day-old symmetrical triangle.
That said, the sluggish signals from the Moving Average Convergence and Divergence (MACD) indicator probe the USD/JPY bears as they approach the stated triangle’s support line, near 138.20 by the press time.
Even so, the 138.00 threshold and the Relative Strength Index (RSI), located at 14, could challenge the pair sellers afterward.
In a case where the USD/JPY stays bearish past 138.00, the odds of witnessing a slump towards the 135.80-60 support zone, comprising levels marked since early August, can’t be ruled out.
Alternatively, a convergence of the 50-SMA and upper line of the aforementioned triangle highlights 140.00 as a tough nut to crack for the USD/JPY bulls.
It should, however, be noted that a fortnight-old horizontal resistance near 142.30-50 will be crucial for the pair buyers as a break that could reverse the latest bearish trend.
Overall, USD/JPY is likely to decline further but the downside room appears limited.
USD/JPY: Four-hour chart
Trend: Limited downside expected
Author

Anil Panchal
FXStreet
Anil Panchal has nearly 15 years of experience in tracking financial markets. With a keen interest in macroeconomics, Anil aptly tracks global news/updates and stays well-informed about the global financial moves and their implications.


