|

USD/JPY Price Analysis: 133.90 appears a tough nut to crack for Yen pair sellers

  • USD/JPY bounces off weekly low to pare intraday losses, portrays two-day downtrend.
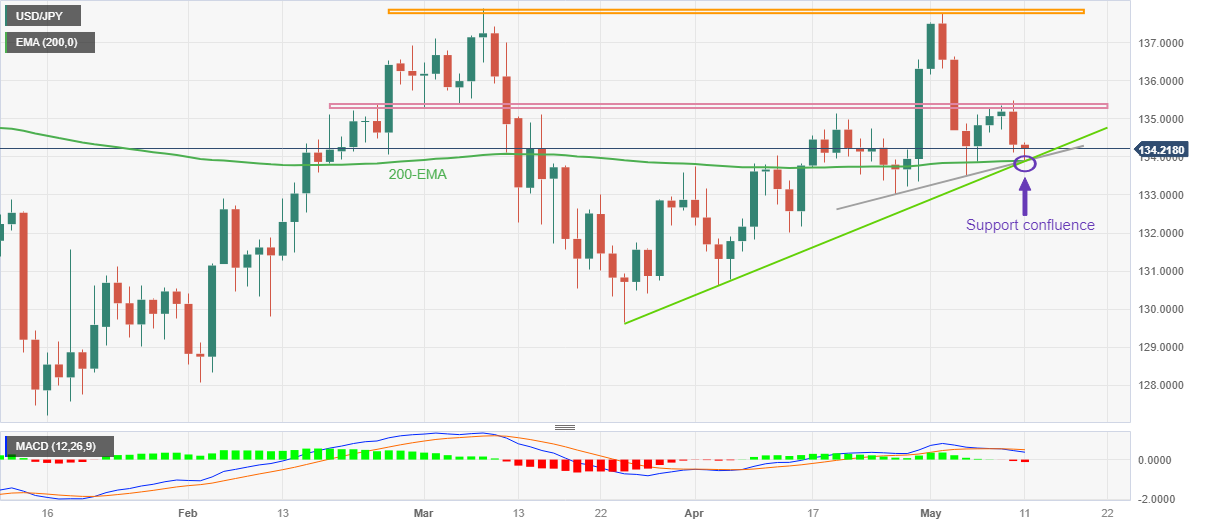
  • Convergence of 200-EMA, short-term support lines highlights 133.90 as the key support.
  • Yen pair’s recovery remains elusive below 135.40 hurdle.

USD/JPY picks up bids to recover from the intraday low, as well as the weekly bottom, as markets remain in consolidation mode during early Thursday. Even so, the Yen pair remains mildly offered near 134.20, printing a two-day losing streak by the press time.

That said, the quote’s failure to cross an 11-week-old horizontal resistance area joined downbeat US inflation numbers to trigger the USD/JPY pair’s U-turn from the weekly high on Wednesday.

The following losses, however, failed to conquer a convergence of the 200-day Exponential Moving Average (EMA), a two-week-old ascending trend line and an upward-sloping support line from March 24, close to 133.90.

It should be noted that the MACD indicator flashes bearish signals and hence the USD/JPY rebound appears elusive, which in turn requires the bulls to cross the aforementioned horizontal resistance area surrounding 135.30-40 to retake control.

Following that, a run-up towards 136.50-60 and the 137.00 round figure can be witnessed on the USD/JPY chart before finding the buyer’s struggle to overcome the double tops around 137.80-90.

On the flip side, a daily closing below 133.90 may quickly drag the Yen pair to a 133.00 round figure before directing it to April’s low of around 130.63.

In a case where the USD/JPY bears remain dominant past 130.63, the 130.00 round figure and March’s bottom of near 129.65 should pop on their radar.

USD/JPY: Daily chart

Trend: Limited upside expected

Additional important levels

Overview
Today last price134.22
Today Daily Change-0.10
Today Daily Change %-0.07%
Today daily open134.32
 
Trends
Daily SMA20134.62
Daily SMA50133.8
Daily SMA100132.87
Daily SMA200137.02
 
Levels
Previous Daily High135.47
Previous Daily Low134.11
Previous Weekly High137.78
Previous Weekly Low133.5
Previous Monthly High136.56
Previous Monthly Low130.63
Daily Fibonacci 38.2%134.63
Daily Fibonacci 61.8%134.95
Daily Pivot Point S1133.8
Daily Pivot Point S2133.28
Daily Pivot Point S3132.44
Daily Pivot Point R1135.16
Daily Pivot Point R2135.99
Daily Pivot Point R3136.51

Author

Anil Panchal

Anil Panchal

FXStreet

Anil Panchal has nearly 15 years of experience in tracking financial markets. With a keen interest in macroeconomics, Anil aptly tracks global news/updates and stays well-informed about the global financial moves and their implications.

More from Anil Panchal
Share:

Editor's Picks

EUR/USD remains bid near 1.1650 post-US ADP

Finally some respite for the risk complex see EUR/USD partially recover from the recent steep sell-off, this time hovering around the 1.1650 zone amid decent gains in a context of renewed selling pressure on the US Dollar. However, the duration and extension of this bounce should be put to the test amid the unabated tensions in the Middle East.

GBP/USD meets resistance around 1.3400

In line with its risk-linked peers, GBP/USD stages a modest comeback on Wednesday, although meeting some resistance around the 1.3400 neighbourhood. Cable’s humble recovery comes on the back of the fresh downward bias in the Greenback amid a marginal improvement in the global sentiment and steady geopolitical effervescence.

Gold flirts with $5,200 amid safe haven demand

Gold partially fades Tuesday’s sharp pullback, regaining the $5,200 mark per troy ounce on the back of the resurgence of investors’ demand for the safe-haven space. The precious metal remains well propped up by the deterioration of the geopolitical scenario in the Middle East, while the softer tone in the US Dollar collaborates with the uptick.

Crypto Today: Bitcoin, Ethereum, XRP rebound amid mixed ETF flows

The cryptocurrency market is showing subtle recovery signs despite heightened global uncertainty following the United States (US) and Israel attacks on Iran and the subsequent retaliations that have morphed into a wider Middle East war.

Asian stocks fall as South Korea’s KOSPI slumps over 10%

Asian equities drop on Middle East tensions; the MSCI Asia Pacific Index falls up to 4%. South Korea’s KOSPI fell 10.71% near 5,170, with the Korean Won weakened past 1,500 per dollar.

Solana Price Forecast: SOL consolidation near resistance as ETF inflows offer mild support

Solana price is facing slight rejection as it approaches the upper boundary of the consolidation range at around $88 on Wednesday. Institutional demand is strengthening as spot Exchange Traded Funds recorded two consecutive inflows so far this week.