|

USD/JPY plunges more than 1%, below 136.00 amidst the uncertainty of the FOMC’s decision

  • US private hiring surged above estimates; the USD/JPY seesawed but later slipped.
  • ISM Non-Manufacturing PMI climbs in April, despite hiring moderation.
  • Traders focus on the US Federal Reserve decision and Powell’s press conference.

The USD/JPY tumbled for the second day in a row, influenced by the fall in the US 10-year Treasury bond yield amidst a mixed market sentiment spurred by the Federal Reserve’s (Fed) monetary policy decision looming. Therefore, US Treasury bond yields are falling, particularly the 10-year, which correlates closely to the USD/JPY pair. At the time of writing, the USD/JPY is trading at 135.14, losing 1.03%.

USD/JPY pressured on falling US bond yields, risk-off mood

US equities are fluctuating ahead of the Fed’s decision. The US ADP Employment Change report, which reveals how private hiring is going in the country, jumped surprisingly by 296K exceeding estimates of 148K and March’s data of 142K. In addition, data showed that albeit hiring rose, wages cooled down from 14.2% to 13.2%, according to the ADP Research Institute report.

After the report, the USD/JPY edged towards 136.00 before making a U-Turn and plunged 60 pips, towards the 135.40 area, before extending its losses.

Of late, the US ISM Non-Manufacturing PMI in April climbed to 51.9 from 51.2 in March, as shown by data. The report showed that a measure of prices paid held close to its lowest level while hiring moderated.

Due to its Golden Week holidays, an absent Japanese economic agenda keeps investors leaning toward US Dollar (USD) dynamics and market sentiment.

The Federal Reserve would unveil its decision ahead of the session, followed by Chair Powell’s press conference, which USD/JPY traders widely expect.

USD/JPY Technical Analysis

USD/JPY Daily Chart

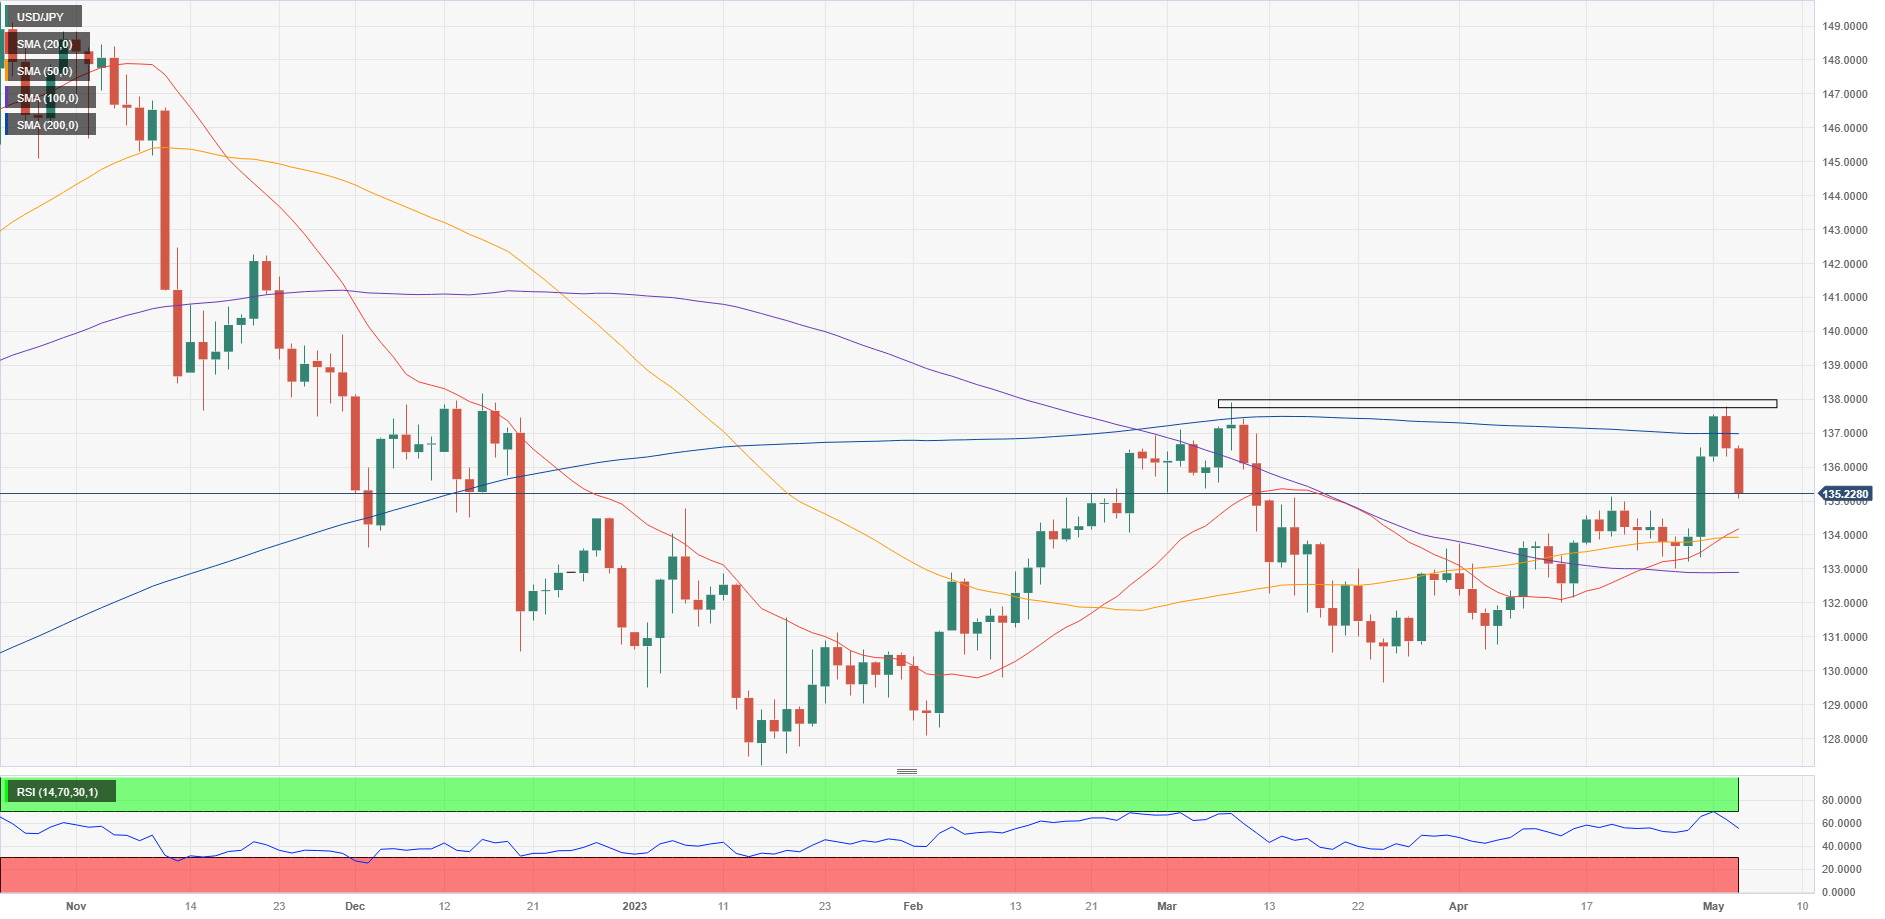
The USD/JPY daily chart portrays the pair as neutral to downward biased after failing to crack the March 8 high of 137.91, exacerbating a fall below the 200-day SMA at 137.43. In addition, a dark-cloud cover candlestick chart pattern, formed during the last two previous days from today, opened the door for the 1% plus drop, with sellers testing previous the April 19 swing high at 135.14; previous resistance turned support. A breach of the latter will expose 135.00, followed by the 20-day SMA at 134.17. Conversely, if USD/JPY buyers hold the spot above April 19 high, the pair could rally to the 136.00 figure.

USD/JPY

Overview
Today last price135.14
Today Daily Change-1.41
Today Daily Change %-1.03
Today daily open136.55
 
Trends
Daily SMA20133.99
Daily SMA50133.93
Daily SMA100132.89
Daily SMA200136.99
 
Levels
Previous Daily High137.78
Previous Daily Low136.31
Previous Weekly High136.56
Previous Weekly Low133.01
Previous Monthly High136.56
Previous Monthly Low130.63
Daily Fibonacci 38.2%136.87
Daily Fibonacci 61.8%137.22
Daily Pivot Point S1135.99
Daily Pivot Point S2135.42
Daily Pivot Point S3134.52
Daily Pivot Point R1137.45
Daily Pivot Point R2138.34
Daily Pivot Point R3138.91

Author

Christian Borjon Valencia

Christian Borjon began his career as a retail trader in 2010, mainly focused on technical analysis and strategies around it. He started as a swing trader, as he used to work in another industry unrelated to the financial markets.

More from Christian Borjon Valencia
Share:

Markets move fast. We move first.

Orange Juice Newsletter brings you expert driven insights - not headlines. Every day on your inbox.

By subscribing you agree to our Terms and conditions.

Editor's Picks

EUR/USD recovers to 1.1750 region as 2025 draws to a close

Following the bearish action seen in the European session on Wednesday, EUR/USD regains its traction and recovery to the 1.1750 region. Nevertheless, the pair's volatility remains low as trading conditions thin out on the last day of the year.

GBP/USD stays weak near 1.3450 on modest USD recovery

GBP/USD remains under modest beairsh pressure and fluctuates at around 1.3450 on Wednesday. The US Dollar finds fresh demand due to the end-of-the-year position adjustments, weighing on the pair amid the pre-New Year trading lull. 

Gold retreats to $4,300 area, looks to post monthly gains

Gold stays on the back foot on the last day of 2025 and trades near $4,300, possibly pressured by profit-taking and position adjustments. Nevertheless, XAU/USD remains on track to post gains for December and extend its winning streak into a fifth consecutive month.

Bitcoin, Ethereum and XRP prepare for a potential New Year rebound

Bitcoin, Ethereum, and Ripple are holding steady on Wednesday after recording minor gains on the previous day. Technically, Bitcoin could extend gains within a triangle pattern while Ethereum and Ripple face critical overhead resistance. 

Economic outlook 2026-2027 in advanced countries: Solidity test

After a year marked by global economic resilience and ending on a note of optimism, 2026 looks promising and could be a year of solid economic performance. In our baseline scenario, we expect most of the supportive factors at work in 2025 to continue to play a role in 2026.

Crypto market outlook for 2026

Year 2025 was volatile, as crypto often is.  Among positive catalysts were favourable regulatory changes in the U.S., rise of Digital Asset Treasuries (DAT), adoption of AI and tokenization of Real-World-Assets (RWA).